Author:
Zachary Katz
Will Revenue Overtake EPS as the Key Driver After Rate Cuts?
In the second quarter of 2024, we observed a subtle but notable shift in market reactions to post-earnings reports, with stock movements increasingly driven by positive EPS surprises relative to Street consensus and revised EPS guidance, despite fewer companies achieving smaller revenue beats over consensus. The quarter highlighted revenue pressures stemming from a challenging macroeconomic environment characterized by factors such as softened consumer demand, U.S. housing shortage, labor cuts, elevated interest rates, and underwhelming economic performance in pockets of the EU and China. We analyzed whether this heightened focus on EPS, rather than revenue, aligns with historical trends observed in the quarters leading up to and following prior Fed rate cuts. Specifically, we examined and compared share performance from previous periods that both preceded and followed anticipated rate cuts over the last 25 years, to determine whether investor attention has traditionally pivoted back to prioritizing top-line performance in such contexts.
While our study’s data suggests that investor focus remains skewed toward EPS surprises and guidance prior to a Fed rate cut (with share prices reacting more strongly to EPS “beats” and “misses” relative to consensus during this quarter than to revenue outperformance), historical trends indicate that this leniency toward lower than average revenue beats might not persist indefinitely. With Street consensus already modeling an acceleration in revenue growth for the second half of the year,1 there is a heightened bar for companies to clear, especially as revenue growth surprises2 have shown a tendency to decelerate following previous rate cut periods. Moreover, the slight uptick in share price reactions post-rate cuts, coupled with deeper revenue misses in certain sectors, suggests that investors could soon recalibrate their expectations. This recalibration could therefore lead to greater scrutiny of top-line performance as the year progresses, emphasizing that rate cuts alone may not be sufficient to sustain optimism if revenue growth fails to meet elevated expectations.

Source: FactSet3
- Q2 Overview: With 92% of S&P 500 companies already reporting, 82% of companies have beaten Q2 earnings estimates (vs. ~77% average over the last five years) and 63% have beat on revenue estimates (vs. ~69% average over last five years).
- Earnings Trends YoY: Year-over-year (YoY), blended EPS growth increased by 10.1%, which is higher than both five- and ten-year averages (9.4% and 8.4%, respectively); meanwhile revenues increased by 3.4%, which is below both the five- and ten-year averages (6.7% and 5.1%, respectively).4
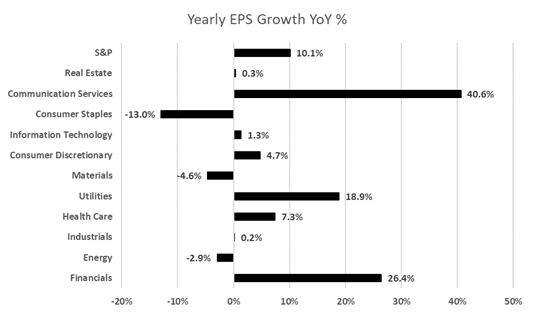
- EPS: 8 of 11 sectors experienced positive EPS growth YoY, with a blended weighted average YoY EPS growth of 10.1%, even higher than the 9.6% seen last quarter (which was highest since Q2’22). In addition, every sector experienced positive earnings surprises vs. consensus, led by Real Estate (+26%), Consumer Discretionary (+15.2%), and Consumer Staples (+10.1%).
- Revenue: 9 of 11 sectors experienced positive revenue growth YoY, totaling a 3.4% blended weighted average growth rate. Revenue surprises were much more muted than EPS surprises (EPS surprise avg. 8.8% versus revenue surprise of 0.8%), with the largest surprises seen among Health Care (+2.8%) and Financials (+2.6%). This marks the 16th consecutive quarter (since COVID-19 impacted Q2’20) of YoY revenue growth for the Index.
- Despite posting earnings and revenue upside surprises, companies in several sectors cited various headwinds stemming from factors including elevated interest rates, uncertainty in China and a mixed consumer backdrop.
- Share Price Reactions: On the day of earnings, companies that beat estimates saw relatively large weighted average share price moves of +2.7%, while those missing estimates experienced a decline of -2.5%, which is higher than in previous quarters (overall one-day average reactions were +0.2%). Over five days, stocks of companies that beat estimates increased by 3.5%, whereas those missing estimates declined by -3.2% (overall five-day average reactions were +0.4%). Recent market volatility has led to more pronounced selloffs in higher-beta stocks. Consequently, many companies that missed estimates have seen a rebound, as reflected in the positive five-day stock reactions.
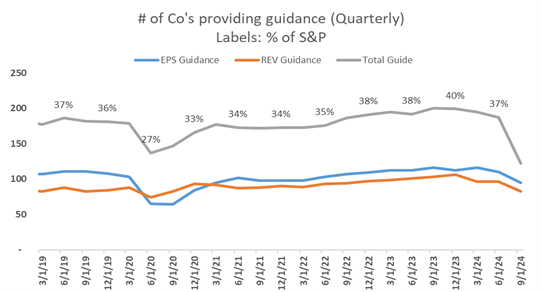
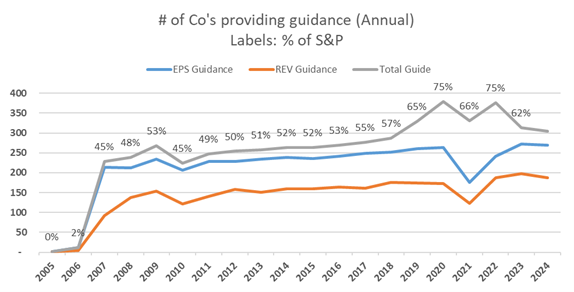
- Guidance: At this point in the earnings season, the total number of companies providing quarterly guidance (currently 24% of the S&P) is below prior quarters (28-30%), while annual guidance (currently 66% of the S&P) is more in line with the five-year average (~69% of S&P).5
Q2’24 Select Economic Highlights
This section examines several key indicators and events shaping the current economic landscape.
Better-than-Expected Economic Data Opens the Door for Potentially Considerable Quantitative Easing in H2: U.S. economic conditions for Q2 have shown signs of resilience despite ongoing challenges. While concerns over higher-for-longer interest rates still exist, the economy has displayed remarkable strength, with key indicators suggesting easing conditions that pave the way for imminent rate cuts (the first since July 2023). Political uncertainties related to the upcoming election and geopolitical tensions in Ukraine and the Middle East remain on the radar, but they have arguably had a limited impact on the overall economic outlook. Furthermore, the unwinding of the yen carry trade, while contributing to temporary market volatility (more on that below), has not significantly derailed investor confidence, as evidenced by the sharp rebound throughout August. As traders recalibrate, equity markets are beginning to stabilize, reducing fears of a prolonged selloff.
Volatility: At the time of this writing, the CBOE Volatility Index (VIX) is back around ~16, its lowest level since early August 2024. The VIX spiked to 65 in early August as investors unwound significant positions like the yen-funded carry trade. Select economists attribute this sharp retreat in August’s market volatility to technical factors rather than major concerns over a global growth slowdown. Notably, the seven trading sessions it took for the VIX to return to its longer-term median is the shortest on record, compared to the average of 170 sessions, according to Reuters.6
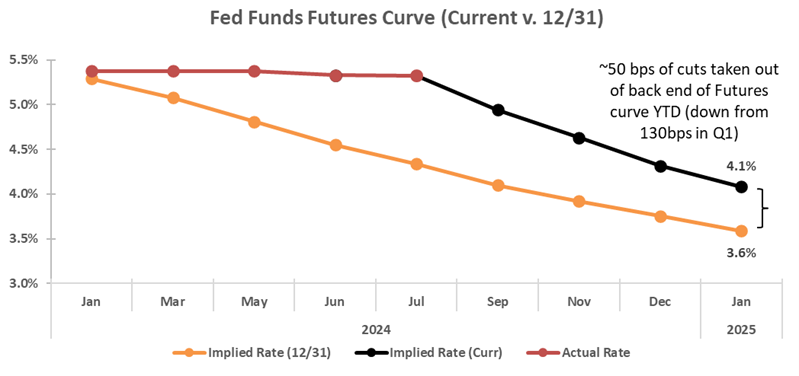
Fed Funds Curve: The Fed is expected to cut rates next month, with Fed Chair Jerome Powell recently exclaiming, “The time has come for policy to adjust.”7 Market expectations have shifted significantly over the last quarter, which now show a 100% probability of at least a 25 bps rate cut in September (markets are pricing in a 35% likelihood of a 50 bps cut in September as of 8/24). Additionally, markets are now pricing in (with 100% probability) at least two cuts by November, with growing speculation of four 25 bps cuts by year-end. This marks a significant shift from expectations last quarter, where markets expected two total rate cuts (~50 bps) by the end of the year.
 Source: FactSet
Inflation Macro Indicators: Inflation continues to decline from its peaks, but pressures from stimulus spending, fiscal policies, and global conflicts are likely to keep inflation above the Fed’s 2% target (currently at 3.2%). Jamie Dimon recently expressed skepticism about achieving the 2% target, suggesting rates may remain higher than pre-pandemic levels unless a recession occurs. The Fed faces the challenge of avoiding premature rate cuts that could exacerbate inflationary pressures and affect stock performance, as seen in early August.
Overall, the market remains in a wait-and-see mode with several key catalysts on the horizon (outlined below). Future inflation data will be crucial, potentially influencing Fed policy. Economic indicators for the quarter have been mixed, with varying PMI figures and a drop in initial jobless claims (still near the highest level since 2022, about 30% higher than the 2019 comparable period) indicating ongoing expansion in the services sector and some resilience in the labor market. However, rising total jobless claims are raising concerns about potential labor market weaknesses.
 Source: Bloomberg
Q1’24 Insights
- Earnings: For Q2’24 (with 92% of S&P 500 companies reporting actual results), 82% of S&P 500 companies have reported a positive EPS surprise and 63% of S&P 500 companies have reported a positive revenue surprise.
- Earnings trends QoQ: The blended QoQ EPS increase for the S&P 500 is 0.9% (vs. Q1’24: -7.8%). The blended QoQ revenue decline for the S&P 500 is -10.5% (vs. Q1’24: -4.5%).
- Earnings trends YoY: For Q2’24, the blended YoY EPS increase for the S&P 500 is 10.1%. The blended revenue increase is 3.4%.
- Guidance: At this point in the earnings season, the number of companies providing guidance has increased (Q3’24 Guidance: 122 companies; FY’24 Guidance: 334 companies):8
- For Q3’24, 13 S&P 500 companies have issued negative EPS guidance and 81 S&P 500 companies have issued positive EPS guidance. 19 S&P 500 companies have issued negative revenue guidance and 58 S&P 500 companies have issued positive revenue guidance.
- The total number of companies providing quarterly guidance (currently 24% of the S&P) is below prior quarters (28-30%), while annual guidance (currently 66% of the S&P) is more in line with the five-year average (~69% of the S&P).
- Of the 272 companies providing EPS FY’24 guidance, 112 raised their yearly guidance higher in Q2, while 40 lowered EPS guidance. In terms of revenue, 178 companies provided higher YoY revenue guides and 39 revised revenue guides down.
Market Is Punishing Negative EPS Surprises More Than Average
82% of companies reporting Q2 results thus far have beat EPS estimates, which is above the five-year and ten-year averages of 77% and 74%, respectively.9
At the sector level, Consumer Staples (94%), Health Care (90%) and Technology (89%) have the highest percentage of companies who reported EPS above estimates. On the contrary, Energy (68%), Financials (74%) and Materials (74%) saw the lowest positive earnings surprises this quarter.
On average, S&P companies have reported EPS 4.5% higher than estimates, which is below the five-year (+8.6%) and ten-year averages (+6.8%). Real estate companies saw an average earnings surprise of +26.0%, followed by Consumer Discretionary (+15.2%) and Consumer Staples (+10.1%). On the contrary, Financials and Industrials saw the smallest earnings surprises (+4.2% and +5.2%, respectively). Revenue surprises for the quarter were much more muted, with results exceeding estimates by 0.9%, on average.
 Source: Factset.
In the second quarter, the market punished negative EPS surprises more than long-term averages. Companies missing EPS estimates saw a -2.5% weighted average one-day decline following their earnings announcements, while companies beating saw an average 2.7% tick up. Meanwhile, companies missing EPS expectations saw a -3.2% five-day stock reaction following their announcements (below the five-year weighted average of -2.3%), while companies beating on EPS saw +3.5% stock reactions five days after their announcements (below the five-year weighted average of +3.8%). On average, all companies reporting saw a five-day weighted average move of +0.4%, which is below the five-year average of +1.0%.
Source: FactSet 10
S&P Earnings Growth Trends In-Line, While Percent of Companies With Revenue Beats Below Average
62% of companies reporting Q2 results have beat sales estimates, which is below the one-year average (67%), five-year average (69%), and ten-year average (64%). The Technology (82%) Health Care (77%) and Financial (65%) sectors saw the highest percentage of companies who reported EPS above estimates. On the contrary, the Utilities (45%), Consumer Staples (46%) and Materials (48%) sectors saw the lowest positive sales surprises this quarter.
On average, S&P companies have reported sales 0.9% higher than estimates, which is below the one-year average (+1.4%), five-year average (+2.0%), and ten-year average (+1.4%). At the sector level, Health Care once again saw the largest revenue beat (+2.6% on average), followed by Technology (+1.7%) and Real Estate (+0.8%). Alternatively, the Energy sector reported the largest negative sales surprise (-1.4% on average).
Source: Factset.11
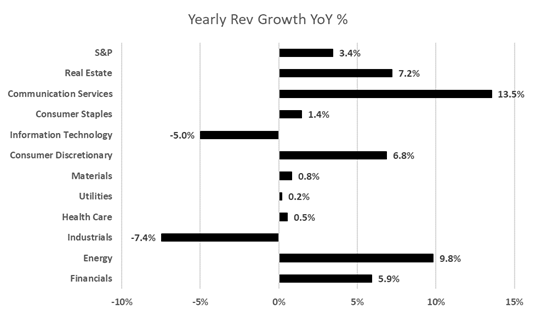
YoY sales for reporting companies increased by 3.4% on average for Q2’24, lower than both the +5.1% seen in Q1 and below the five-year average of +6.7%. The Communications sector saw the largest weighted average quarterly revenue growth YoY (+13.5%), followed by the Energy and Real Estate Sectors. Meanwhile, the Industrials (-7.4%) and Tech (-5.0%) sectors saw the largest revenue declines in Q2 as compared to the same period last year.
In fact, if the tech-laden “Magnificent 7” companies12 are excluded, the S&P’s Q2 sales growth declined by a whopping -8.2% using our weighted average methodology.13
Source: FactSet 14,15
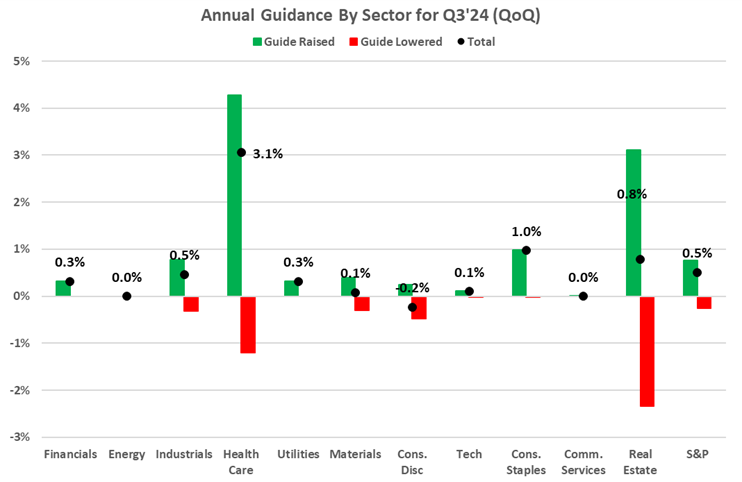
Guidance Trends: Stronger Than Usual Positive Quarterly Earnings Guidance
With 92% of S&P 500 companies having reported, the total number of companies providing quarterly guidance (currently 24% of the S&P) is below prior quarters (28-30%), while annual guidance (currently 66% of the S&P) is more in line with the five-year average (~69% of the S&P).
For Q3, 13 S&P 500 companies have issued negative EPS guidance and 81 S&P 500 companies have issued positive EPS guidance. Of the companies who have given guidance, the percentage of companies issuing negative EPS guidance for Q3’24 is 15% (10 out of 91), which is well below both the five-year and ten-year average of 59% and 63%, respectively. In addition, 19 S&P 500 companies have issued negative revenue guidance and 58 S&P 500 companies have issued positive revenue guidance.
 Source: Factset.
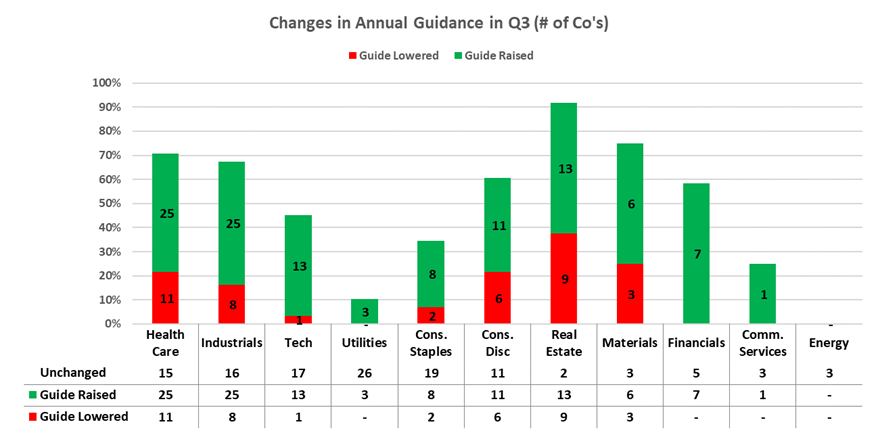
For the full year, 334 companies (66% of the S&P) have provided any sort of guidance, while 272 companies (54% of the S&P) have provided FY’24 EPS guidance;17 throughout this quarter, 112 companies raised their full year EPS outlook (led by the Health Care and Industrials sectors with 25 companies each), and 40 lowered (Health Care also leads on this front with 11 EPS reductions, largely related to delays in timing for China stimulus that has affected MedTech and equipment manufacturers’ orders throughout the first half of the year). For revenue, 178 companies provided higher YoY revenue guides and 39 revised revenue guides down.
 Source: Factset.
Rate Cut Countdown: EPS Surprises Drive Market Reactions:
In the second quarter of 2024, we observed a subtle but notable shift in market reactions to post-earnings reports, with stock movements increasingly driven by positive EPS surprises relative to Street consensus and revised EPS guidance, despite fewer companies achieving smaller revenue beats over consensus. The quarter highlighted revenue pressures stemming from a challenging macroeconomic environment characterized by factors such as softened consumer demand, U.S. housing shortage, labor cuts, elevated interest rates, and underwhelming economic performance in pockets of the EU and China. We analyzed whether this heightened focus on EPS, rather than revenue, aligns with historical trends observed in the quarters leading up to and following prior Fed rate cuts. Specifically, we examined and compared share performance from previous periods that both preceded and followed anticipated rate cuts over the last 25 years, to determine whether investor attention has traditionally pivoted back to prioritizing top-line performance in such contexts.

Source: FactSet
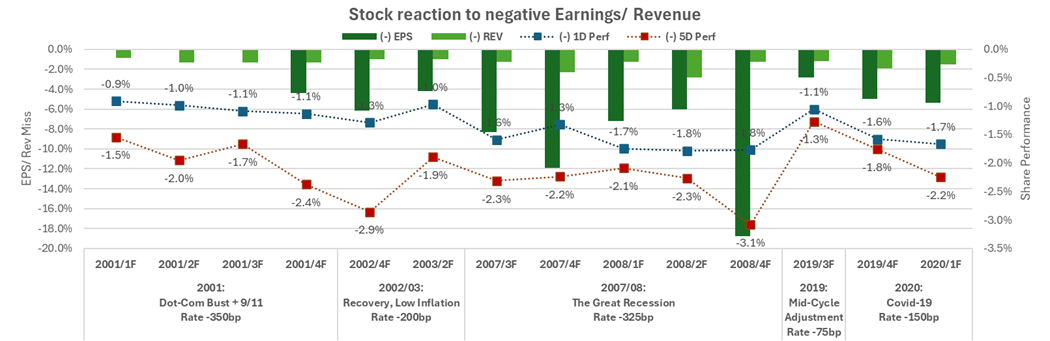
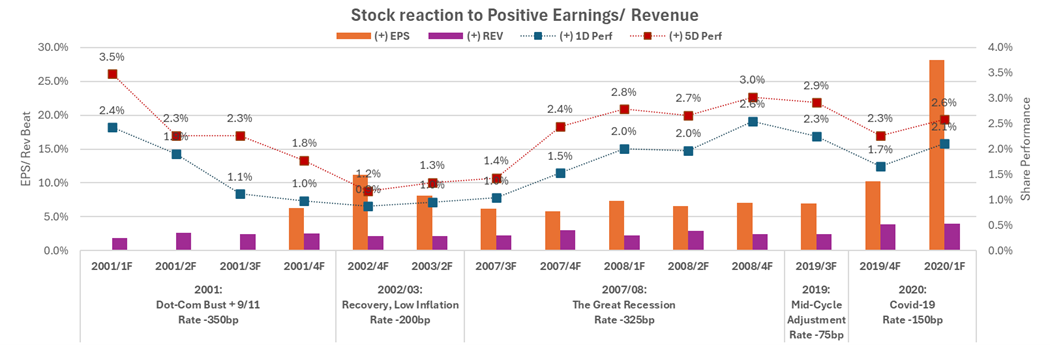
To explore this, we have drawn comparisons across five historical periods in which we’ve seen a total of 14 rate cuts – the Dot-com bust and the 9/11 aftermath, the low-inflation recovery of 2002-03, the Great Recession, the mid-cycle adjustments of 2019, and the COVID-19 pandemic in 2020. By examining market responses to revenue and earnings performance in the quarters following previous rate cuts, we assessed whether the trend of leniency toward revenue pressures is likely to continue or if there is a historical tendency for a renewed focus on revenue growth during such times.
Our analysis proceeded in two phases. First, we examined all 14 instances of rate cuts since 2000, comparing market reactions during the quarter of the rate cut with those in the subsequent quarter. On a weighted average, share prices exhibited reactions consistent with long-term trends, with a marginal difference of -0.1% (+0.3% during the rate-cut quarter versus +0.2% afterward).18 Additionally, we observed a slightly more favorable five-day post-earnings reaction in the quarter following rate cuts (+0.4% compared to +0.2% during the cut). Surprisingly, contrary to expectations that lower interest rates would drive higher revenues, growth rates, and larger revenue beats versus consensus, average sales growth actually decelerated in the quarter following rate cuts (+1.2% during the cut vs. +1.0% afterward). Specifically, companies reporting positive revenue growth saw an improvement from +2.6% to +3.0%, while those with revenue declines experienced a deepening of misses from -1.4% to -2.0%. Meanwhile, EPS growth displayed a more pronounced increase, rising by 2.2% relative to the periods prior to the Fed cuts (+4.3% vs. +2.2%).
 Source: Factset.
In our second analysis, we focused exclusively on the first instance of rate cuts within each easing period, eliminating the compounding effects of subsequent cuts. The results largely mirrored our broader analysis, though the differences in revenue and EPS growth were more muted. Revenue growth in the first quarter after the initial rate cut averaged +1.4%, slightly above the +1.2% during the quarter prior to the rate cut, while EPS growth showed a modest decline to +2.9% from +3.1% (which is lower than the +4.3% average observed across all rate cut periods). This minor decline in EPS growth, combined with marginally improved revenue figures, resulted in more favorable one-day and five-day share price reactions, with one-day movements averaging +0.1% (compared to -0.1% across all rate cut periods) and five-day movements reaching +0.3% (versus +0.2% across all periods).
 Source: Factset.
Update on the S&P’s “Back-End Loaded” Set-Up to Achieve Full Year Guidance
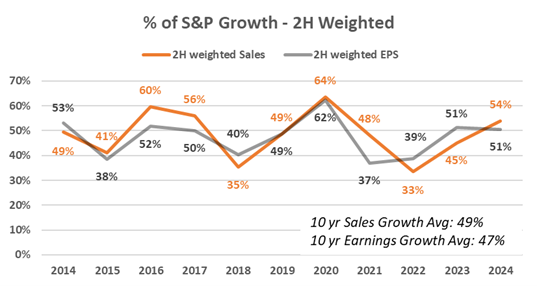
Last quarter (Q1’24), we observed a notable trend where an unusually high percentage of companies were depending on a strong second half to meet their full-year targets. Specifically, 58% of companies were anticipating stronger sales growth in the latter part of the year, while 51% were counting on strong H2 EPS growth to drive their annual performance.
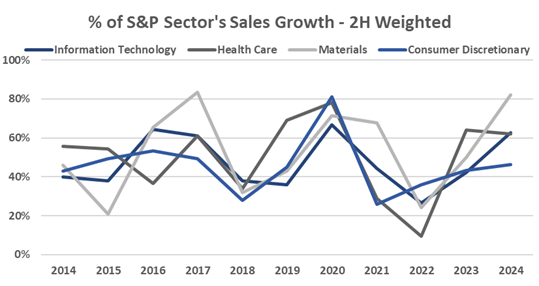
In contrast to Q1, we’ve seen a slight reduction in this H2 dependency as Q2 progresses. The percentage of companies expecting stronger sales growth in the latter half of the year has decreased from 58% in Q1 to 54%, likely due to adjustments to companies’ full-year outlooks. When it comes to EPS, the reliance on H2 strength remains stable, with 51% of companies still expecting the majority of their EPS growth in the latter half of the year – unchanged from Q1. However, both figures are still notably higher than the ten-year averages, which have seen 49% of companies rely on stronger back-half sales and 47% on EPS. This trend is especially true in the Tech, Health Care and Materials sectors, which are seeing upticks in back-end dependency to achieve their full-year guidance, on average. This ongoing trend underscores the heightened pressure on management teams to deliver in the remaining months of FY’24.
Source: FactSet.
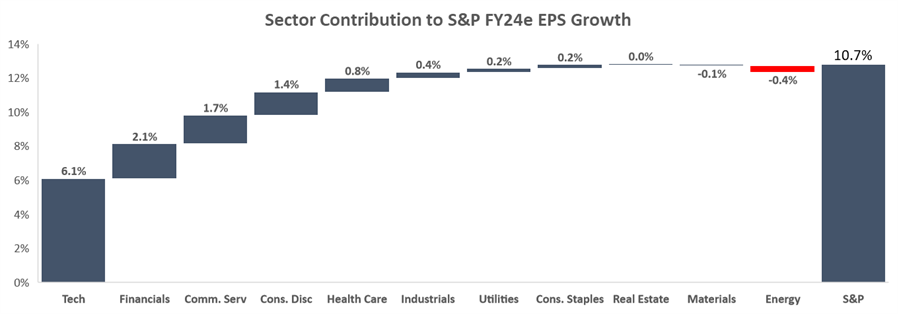
Overall, consensus FY’24 S&P EPS growth of +10.7% is projected to come from the Technology, Financials, Communication Services, and Consumer Discretionary sectors. Following Q1’24 and Q2’24 blended YoY EPS increases of 9.6% and 10.1%, respectively, consensus estimates are projecting EPS growth YoY of +13.0% and +9.7% for Q3 and Q4’24, respectively.
 Source: Factset.
1The percentage of companies expecting stronger sales growth in the latter half of the year versus the first half of the year is 54%.
2Revenue growth rates versus consensus (positive surprise when revenue grew faster than consensus and vice versa).
3The charts compare market reactions and Sales/Earnings beat percentages during all 14 quarters of rate cuts since 2000 with those in the subsequent quarter. On a weighted average, share prices exhibited reactions consistent with long-term trends, with a marginal difference of -0.1% (+0.3% during the rate-cut quarter versus +0.2% afterward).
4Factset
5As of 8/24/24 using our own methodology with data from Factset.
6Reuters.
7Comments made during the highly anticipated speech at the Kansas City Fed’s annual economic conference in Jackson Hole, Wyoming (speech transcript included here: https://www.federalreserve.gov/newsevents/speech/powell20240823a.htm).
8Factset.
9Ibid.
10Total Guide represents the sum of companies that guided at least one of the following metrics: EPS, Revenue, EBITDA, Net Income, CapEx, Free Cash Flow, SS NOI, and Net Interest Income.
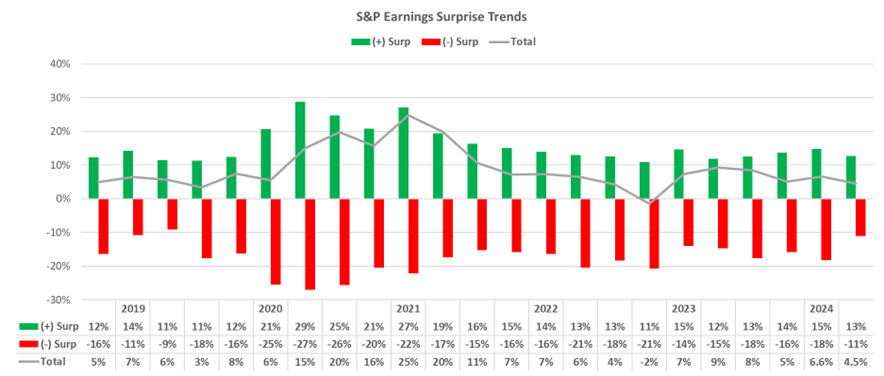
11Earnings surprises broken down by positive and negative surprises for all 11 S&P sectors.
12The Magnificent 7 include Microsoft, Amazon, Nvidia, Alphabet, Google, Tesla, and Meta.
13After taking out the Magnificent 7 (~35% of the S&P 500 by weight as of August 20), we re-weighted the other constituents of the S&P.
14Weighted average EPS and revenue growth.
15Some companies have outsized impacts on these weighted growth metrics. For example, Meta and Alphabet make up ~31% of the sector by weight, and saw EPS growth of 31% and 73%, respectively; as a result, the two companies contributed ~64% of the sector’s 46% YoY EPS growth.
16As of 8/21/24 using our own methodology with data from Factset. These include a total of 502 companies within the S&P 500, and factor in companies that do not provide any guidance (in addition to companies with unchanged, positive/raised, and negative/lowered guidance).
17For overall metrics, we consider whether a company gives guidance for any of EPS, revenue, EBITDA, net income, net operating income, or net interest outcome. However, for the more detailed analysis, we only looked at EPS and revenue figures.
18A key limitation in our analysis is that for periods prior to 2007 (during which 6 of the 11 rate cuts occurred before the Great Recession), we were unable to consistently determine whether companies reported earnings before or after the market opened, which could influence the one-day and five-day stock reaction metrics. In cases where the reporting time was indeterminable, we assumed the companies reported after market close.
Disclosures
This paper has been prepared by Consello MB LLC (“Consello”) for the party to whom it has been addressed and delivered and may not be used or relied upon for any purpose other than as specifically contemplated. This paper is based on information provided by or on behalf third parties, from public sources or otherwise reviewed by Consello. Consello assumes no responsibility for independent investigation or verification of such information and has relied on such information being complete and accurate in all material respects. To the extent such information includes estimates and forecasts of future financial performance or events, Consello has assumed that such estimates and forecasts are reasonable. No representation or warranty, express or implied, is made as to the accuracy or completeness of such information and nothing contained herein is, or shall be relied upon as, a representation, whether as to the past, the present or the future. This paper should not be considered a recommendation with respect to any matter. This paper has been developed by and is proprietary to Consello.
This paper was compiled on a confidential basis and not with a view to public disclosure or filing thereof under state or federal securities laws, and may not be reproduced, disseminated, quoted or referred to, in whole or in part, without the prior written consent of Consello.
This paper does not constitute an offer to sell or a solicitation of an offer to purchase any securities and is not a commitment by Consello (or any affiliate) to provide or arrange any financing for any transaction or to purchase any security in connection therewith. This paper may not reflect information known to other professionals in other business areas of Consello and its affiliates.
Consello and its affiliates do not provide legal, accounting or tax advice. Accordingly, any statements contained herein as to tax matters were neither written nor intended by Consello or its affiliates to be used and cannot be used by any taxpayer for the purpose of avoiding tax penalties that may be imposed on such taxpayer. Each person should seek legal, accounting and tax advice based on his, her or its particular circumstances from independent advisors regarding the impact of the transactions or matters described herein.
Broker-dealer services are provided through Consello Financial LLC (Member FINRA and SIPC).
Opinion and Belief; Forward-Looking Statements
Past performance is not necessarily indicative of future results. Certain statements contained in this paper may be based on current expectations, estimates, projections, opinions and beliefs of Consello. All views expressed and any statements relating to expectations regarding future events represent Consello’s own assessment and interpretation of information available to it as at the date of this paper. Such statements involve known and unknown risks, uncertainties and other factors, and undue reliance should not be placed thereon. Such statements represent solely the opinion or belief of Consello and are not expressed herein as the opinion or belief of any other entity or of members of the Consello team or other persons. No representation is made or assurance given that such statements or views are correct. Opinions expressed and other information or statements herein are subject to change without notice. Any discussion of general market activity, industry or sector trends, or other broad-based economic, market, political or regulatory conditions should not be construed as research or advice.
Additionally, this paper contains “forward-looking statements,” which can be identified by the use of terms such as “may”, “will”, “should”, “expect”, “anticipate”, “project”, “estimate”, “intend”, “see”, “continue,” “target,” “plan” or “believe” (or the negatives thereof) or other variations thereon or comparable terminology or forward-looking context. Furthermore, any projections or other estimates in this paper are “forward-looking statements” and are based upon certain assumptions that may change. Due to various risks and uncertainties, actual events may differ materially from those reflected or contemplated in such forward-looking statements. Moreover, actual events are difficult to project and often depend upon factors that are beyond the control of Consello and its affiliates. Recipients of this paper should not rely on such forward-looking statements, and no representation or warranty is made as to future events or results or such forward-looking statements. Nothing in this paper constitutes a guarantee, projection or prediction of future events or results.
Unless otherwise noted, information in this paper is presented as of the date hereof and does not reflect any facts, events or circumstances that may have arisen after that date, is subject to discussion, completion and amendment and does not contain all information necessary to fully evaluate any transaction. Neither Consello nor any other person has any obligation to update this paper (including forward-looking statements herein) or correct inaccuracies or omissions in it.
Copyright © 2024 Consello MB LLC. All rights reserved.