
Executive Summary:
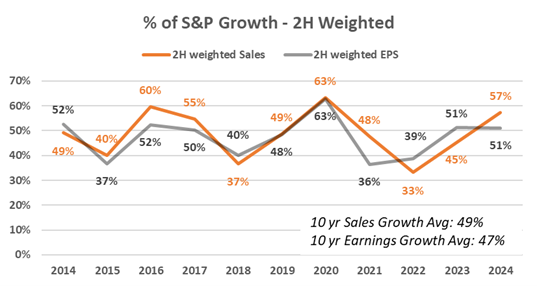
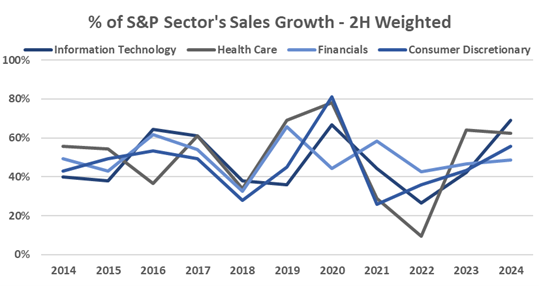
Exiting the first quarter of 2024, we observe a “back-end loaded” set-up for S&P 500 companies, which are relying on a stronger second half of the calendar year to achieve their full year guidance for FY’24. In fact, 58% of the FY’24 sales growth guidance for S&P 500 companies is expected to be achieved in the second half (2H), surpassing averages from the past ten years (excluding the COVID-19 period and 2016). This shift coincides with both Q1 revenue growth and revenue beats relative to consensus falling below historical averages, as companies contended with macroeconomic challenges and elevated interest rates. The 2H weighting trend is most evident in sectors including Technology, Financials, Health Care, and Consumer Discretionary, where these companies faced not only typical seasonality but also increased consumer softness, delayed large purchases due to higher interest rates, and uncertainty around China’s new stimulus program. While the trend is most pronounced in revenues versus earnings, 51% of the S&P 500’s earnings outlook for FY’24 is also projected to be concentrated in the latter half of the year, a figure markedly higher than the ~40% post-COVID average.1
This quarterly report highlights three key themes. First, while Q1 earnings have been robust, revenue growth and surprise have been slightly below averages, indicating a softness that necessitates a heavy reliance on the second half for meeting full-year targets, particularly in select sectors. Second, while S&P company revenue estimates are weighted toward the second half, emerging optimism from better recent economic data and potential for rate cuts suggests that these full-year targets could be achievable. Third, market reactions have been particularly harsh towards companies missing consensus estimates, with negative surprises being heavily penalized and positive surprises receiving muted responses.
This dynamic puts extra spotlight on performance and full-year guidance considerations as we head further into 2024. The critical need for strong back-half performance to meet FY’24 outlooks is especially pressing now, given a particularly judgmental stock market around earnings, all while revenue growth is decelerating compared to historical averages and revenue beats are becoming smaller in magnitude.
Source: FactSet
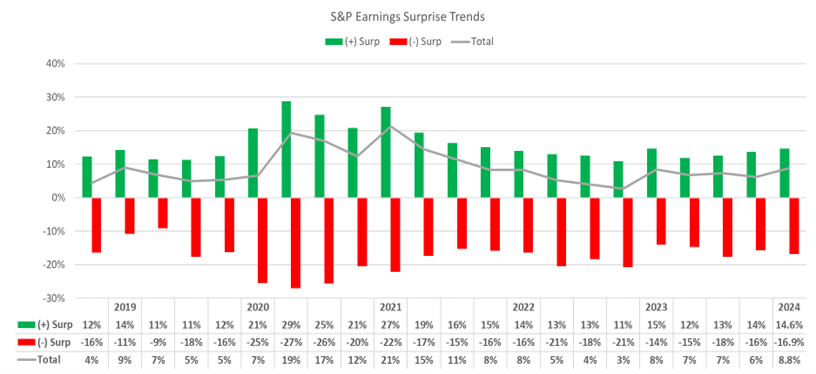
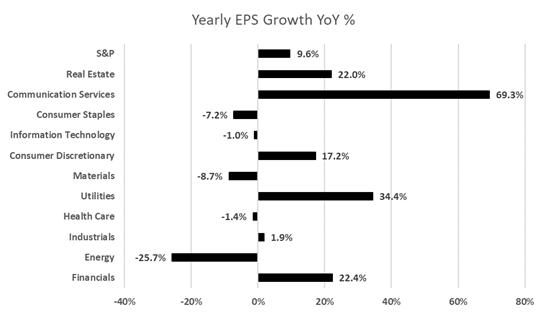
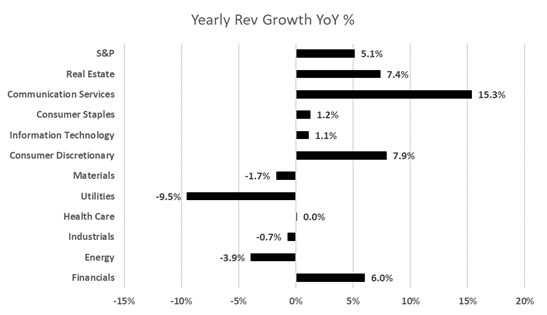
- Q1 Overview: In Q1’24, S&P 500 earnings reports demonstrated a mixed performance with robust earnings surprises but below-average revenue surprises. Despite select challenges, companies continued to show quarterly revenue and earnings growth. 74% of S&P 500 constituents reported a positive EPS surprise, falling below the five-year average of 77% and in-line with the ten-year average of 74%. However, only 63% of S&P 500 companies reported a positive revenue surprise, which is below the five-year and ten-year averages of 69% and 64%, respectively. Year-over-year (YoY), earnings growth decelerated slightly compared to Q4’23, with a 9.6% increase in EPS. Revenue growth YoY was 5.1%, which is below the five-year average of 6.7%.2
- 6 of 11 sectors experienced positive earnings growth YoY, while every sector experienced positive surprises vs. consensus, led by Real Estate (+33%), Consumer Discretionary (+16.8%), and Consumer Staples (+11.7%). The 9.6% blended YoY earnings growth is the highest YoY earnings growth rate since Q2’22.
- Similarly, 7 of 11 sectors experienced positive revenue growth YoY, while 8 sectors experienced positive surprises vs. consensus, led by Health Care (+3.0%) and Financials (+2.5%). This marks the 14th consecutive quarter (since Covid impacted Q2’20) of YoY revenue growth for the Index.
- Despite posting earnings and revenue upside surprises, companies in various sectors cited various headwinds stemming from factors including elevated interest rates, uncertainty in China and a mixed consumer backdrop.
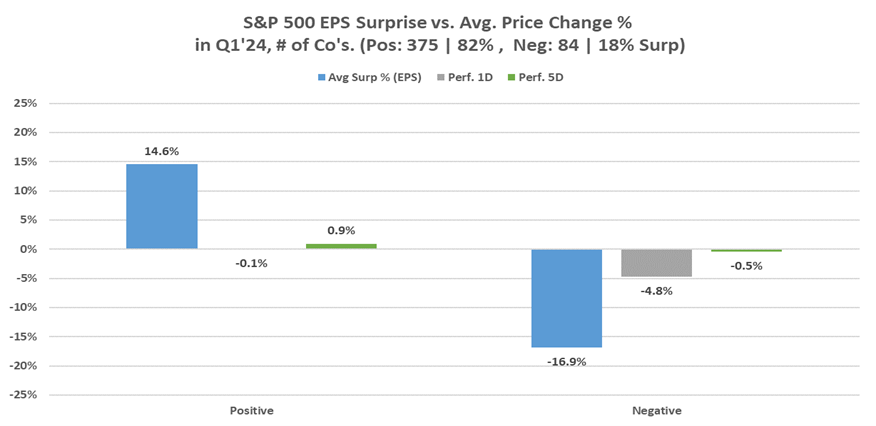
- Share price reactions: On the day of earnings, companies missing earnings estimates saw an average -4.8% stock price decline, while those beating estimates saw an average -0.1% decline. Five-day stock reactions were -0.5% for companies missing earnings and +0.8% for those exceeding estimates.
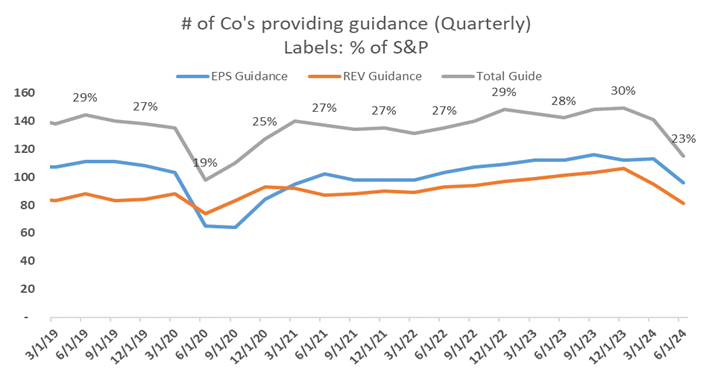
- Guidance: The number of companies providing quarterly guidance decreased, with 23% of the S&P offering guidance compared to 28-30% in prior quarters. For FY’24, 236 companies projected growth over FY’23 and 45 projected lower EPS guides. Additionally, 178 companies issued higher YoY revenue guides, while 32 revised revenue guides downward.3
Q1’24 Select Economic Highlights
This section examines several key indicators and events shaping the current economic landscape.
Inflation finally cooling; Market now expecting two rate cuts this year:
U.S. inflation eased slightly in April, offering relief following a three-month run of inflation data that was firmer than anticipated. The CPI, a gauge for goods and service costs across the U.S. economy, rose 3.4% YoY in April. Core prices (excluding volatile food and energy items) climbed 3.6% YoY, which was the lowest increase since April 2021.
A separate report showed retail sales were flat in April, suggesting to some economists that economic activity may not be reaccelerating despite cooler inflation.
Most economists expect the Fed to cut interest rates this year but are divided over when. Because it will likely take another two reports to shore up officials’ confidence that inflation can return to the lower levels that prevailed before the pandemic, many expect the Fed to cut rates first in September.
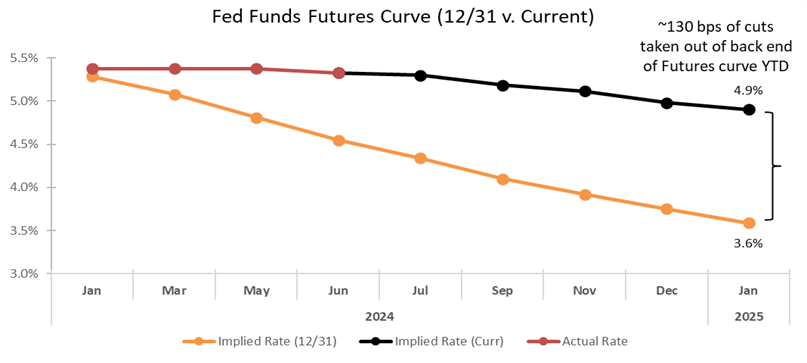
Fed officials “didn’t expect this to be a smooth road,” but Q1 inflation readings “were higher than anybody expected,” Chairman Powell said following the Fed’s May meeting. “This has told us that we’ll need to be patient and let restrictive policy do its work.” Given inflation continues to surpass the Fed’s long-term target and the recent PCE reading coming in lower than expected for only the first time this year, the market has scaled back its anticipation of Fed cuts by ~130 bps since the close of 2023.
 Source: FactSet
Presidential election update:
According to BCA Research, “Incumbents” are reelected in the US presidential election 80% of the time as long as there is no recession in the year or two beforehand. The research firm notes that Biden’s age and mixed sentiment around inflation puts his approval rating currently below Trump’s and Obama’s at the same stage of their first terms.4 While current polls suggest that Biden is slightly favored to win, some investors are also asking what a second Trump administration could look like, and how markets could potentially react.
China’s economic recovery tilted even further toward manufacturing:
Economists argue that China’s manufacturing sector, bolstered by robust foreign demand and favorable policy, has largely powered the country’s recovery this year. Exports returned to growth in April, but growth in consumer spending unexpectedly cooled to 2.3% in April, the slowest pace since 2022. At the same time, industrial output rose from a month ago to a faster-than-expected 6.7% rate.5 Credit also shrank for the first time since 2005.
In addition, as a drawn-out housing crisis weighs on sentiment, the CCP has signaled more support to boost demand. The PBOC recently removed the floor on mortgage rates, lowered the minimum down payment ratios for individual homebuyers and set aside $42 billion of funding to buy unsold homes.
In the meantime, Beijing began to sell its 1 trillion yuan ($138 billion) ultra-long special sovereign bonds, which could fund infrastructure spending critical to growth. That’s spurred expectations of monetary easing to help banks buy the notes.
Q1’24 Insights
- Earnings: For Q1’24 (with 92% of S&P 500 companies reporting actual results), 74% of S&P 500 companies have reported a positive EPS surprise and 63% of S&P 500 companies have reported a positive revenue surprise.
- Earnings trends QoQ: The blended QoQ earnings decline for the S&P 500 is -7.8% (2.1% less than Q4’23). The blended QoQ revenue decline for the S&P 500 is -4.5% (6.0% more than Q4’23).
- Earnings trends YoY: For Q1’24, the blended YoY earnings increase for the S&P 500 is 9.6%. The blended YoY revenue increase for the S&P 500 is 5.1% (3.3% higher than Q4’23).
- Guidance: At this point in the earnings season, the number of companies providing guidance has increased (Q2’24 Guidance: 115 companies; FY’24 Guidance: 281 companies):6
- For Q2’24, 23 S&P 500 companies have issued negative EPS guidance and 94 S&P 500 companies have issued positive EPS guidance. 19 S&P 500 companies have issued negative revenue guidance and 81 S&P 500 companies have issued positive revenue guidance.
- The total number of companies providing guidance (currently 23% of the S&P) is below prior quarters (28-30%).
- 236 companies have provided EPS FY’24 guidance higher vs FY’23 and 45 have provided EPS guidance lower vs FY’23. For revenue, 178 companies provided higher YoY revenue guides and 32 revised revenue guides down.
 Source: FactSet. 7
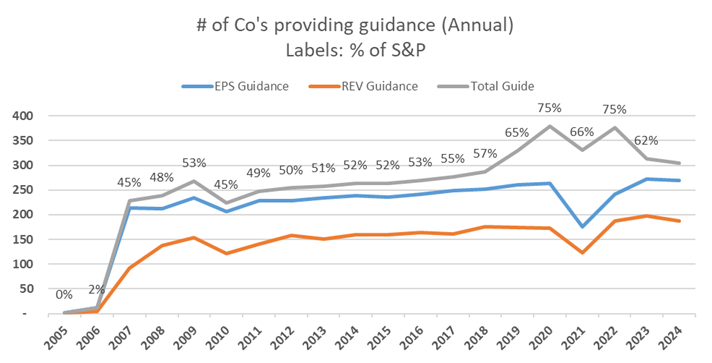 Source: FactSet. 8
The Market is Punishing Negative EPS Surprises More Than Average
81% of companies reporting Q1 results thus far have beat EPS estimates, which is above the five-year average (77%) and the ten-year average (74%).9 At the sector level, Consumer Staples (96%), Health Care (90%) and Technology (88%) have the highest percentage of companies who reported earnings above estimates. On the contrary, Energy (68%), Materials (71%) and Consumer Discretionary (74%) saw the lowest positive earnings surprises this quarter.
On average, S&P companies have reported earnings 8.8% higher than estimates, which is above the five-year (+8.5%) and ten-year averages (+6.7%). Real estate companies saw an average earnings surprise of +33% followed by Consumer Discretionary (+16.8%) and Consumer Staples (+11.7%). Communications and Utilities companies saw the smallest earnings surprises (+0.2% and +2.1%, respectively).
During this quarter, the market has punished negative earnings surprises more heavily than average. Companies missing earnings estimates saw a -4.8% one-day decline following their earnings announcements, while companies beating saw an average -0.1% tick down. Companies missing saw a -0.5% five-day stock reaction following their announcements, while companies beating earnings saw +0.8% stock reactions five days after their announcements.
 Source: FactSet. 10
Percentage of Companies Beating Revenue Estimates Below Averages
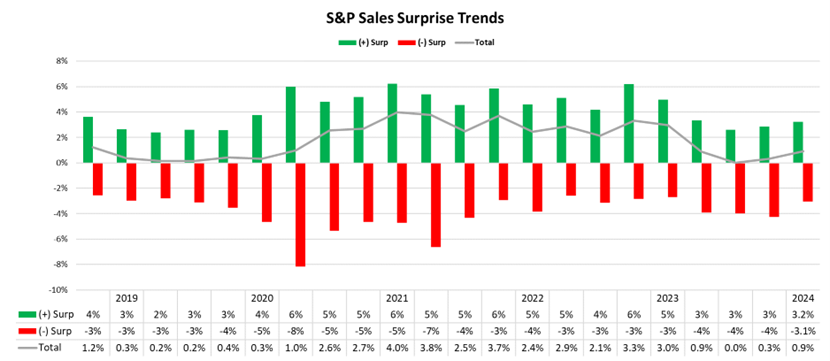
63% of companies reporting Q1 results thus far have beat sales estimates, which is below the one-year average (67%), five-year average (69%), and ten-year average (64%). The Real Estate (74%), Health Care (72%) and Technology (72%) sectors saw the highest percentage of companies who reported earnings above estimates. On the contrary, the Utilities (32%), Materials (50%) and Industrials (56%) sectors saw the lowest positive sales surprises this quarter.
On average, S&P companies have reported sales 0.9% higher than estimates, which is below the one-year average (+1.4%), five-year average (+2.0%), and ten-year average (+1.4%). At the sector level, Health Care saw the largest revenue beat (+3.0% on average), followed by Financials (+2.5%) and Consumer Staples (+1.4%). Alternatively, the Utilities sector reported the largest negative sales surprise (-4.4% on average).
S&P Earnings Growth Trends In Line with Long-Term Averages While Revenues Exceeding Averages
YoY sales for reporting companies increased by 5.1% on average for Q1’24, which is below the five-year average of 6.7% in Q1. On average, S&P companies reported a 0.9% revenue surprise YoY (with 63% of companies reporting positive surprises). By sector, Health Care and Financial companies had the largest YoY earnings surprises of 3.0% and 2.5%, respectively.
 Source: FactSet. 11
YoY revenues increased 5.1%, which is significantly higher than the 1.8% YoY revenue growth seen throughout Q4’23. As we’ve seen in earnings trends, Communications Services companies saw the largest YoY revenue growth on average, growing 15.3%.
Source: FactSet 12
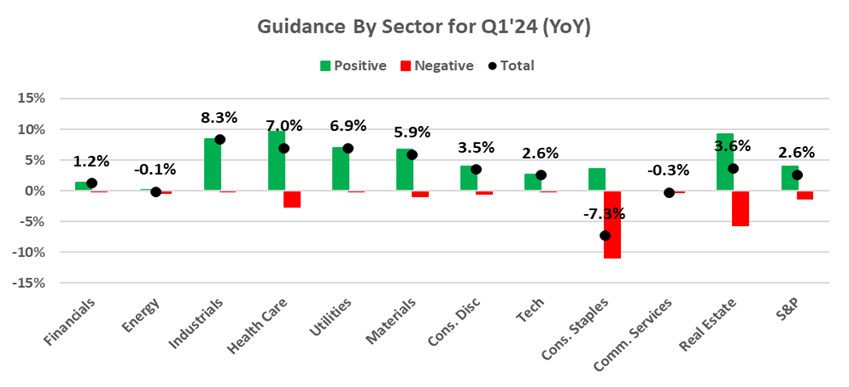
Guidance Trends: Heavily Reliant on Strong Back-Half of the Year to Achieve FY’24 Earnings Growth
With 92% of the S&P companies reporting this quarter, the number of companies providing guidance has increased (Q2’24 Guidance: 117 companies; FY’24 Guidance: 281 companies).13 For Q2’24, 117 companies have issued EPS guidance – 94 of which issued positive guidance and 23 issued negative guidance, and 100 companies have issued Revenue guidance – 81 of which issued positive guidance and 19 issued negative guidance.14 The total number of companies providing quarterly guidance (currently 23% of the S&P) is below prior quarters (28-30%).
281 companies in the Index have issued EPS guidance for the upcoming fiscal year (FY’24), with 236 providing EPS guides higher vs FY’23 and 45 providing EPS guides lower vs FY’23, and 178 providing higher YoY revenue guides and 32 revising revenue guides down (out of 210 companies that provided revenue guidance).
 Source: FactSet.
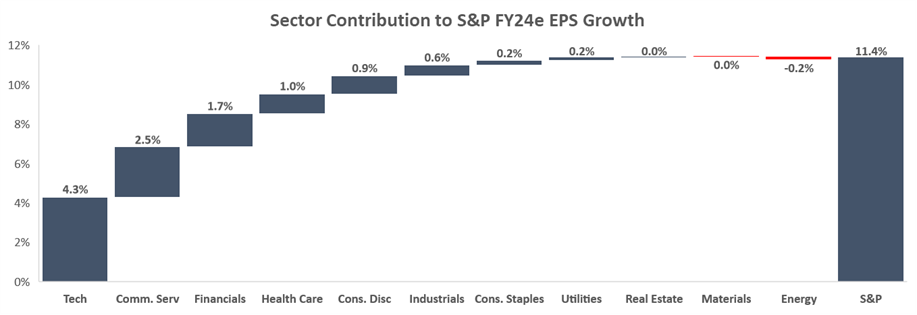
Overall, consensus FY’24 S&P EPS growth of 11.4% is projected to come from the Technology, Communication Services, Financials, and Health Care sectors. Following a Q1’24 blended YoY earnings increase of 9.6%, consensus estimates are projecting earnings growth YoY of 9.2%, 8.2% and 17.4% for Q2, Q3 and Q4’24, respectively.
 Source: FactSet.
This quarter, we observe a trend where companies will need to rely on a strong second half to meet their FY’24 targets. A considerable number of companies have faced challenges in Q1 due to macroeconomic issues such as prolonged high interest rates and softness in both China and broadly with a mixed consumer. Our calculations show 58% of the FY’24 sales growth guidance for S&P 500 companies is expected to be achieved in the 2H, surpassing averages from the past ten years, excluding the COVID-19 period and 2016. This shift coincides with both Q1 revenue growth and revenue beats relative to consensus falling below historical averages, as companies contended with macroeconomic challenges and elevated interest rates. The 2H weighting trend is most evident in sectors including Technology, Financials, Health Care, and Consumer Discretionary, where companies faced not only typical seasonality, but also increased consumer softness, delayed large purchases due to higher interest rates, and uncertainty around China’s new stimulus program. This is largely due to (1) industry seasonality, with holidays and increased spending typically occurring in Q4, (2) slowdown in large purchases due to higher interest rates and higher-for-longer inflationary purchases, and (3) customers delaying orders while awaiting clarity on China’s new stimulus program, particularly affecting the Health Care industry.
In addition, while the trend is most pronounced in revenues versus earnings, 51% of the S&P 500’s earnings outlook for FY’24 is also projected to be concentrated in the latter half of the year, a figure markedly higher than the ~40% post-COVID average.

Source: FactSet 12

Update on the Momentum Trade
Last quarter (Q4’23), we witnessed the S&P 500’s impressive period of positive momentum, reaching all-time highs and closing higher in 16 of the last 18 weeks. This remarkable performance resulted in a ~22% increase since the momentum began in November 2023, marking the longest streak of positive closes since 1971. After the paper was released on March 6th, the momentum ended, with the subsequent 12 weeks experiencing 7 weeks of positive returns and 5 weeks of negative returns. Currently, the S&P is once again demonstrating strong upward momentum, finishing its 5th consecutive week up, with an overall increase of +6.6%.15
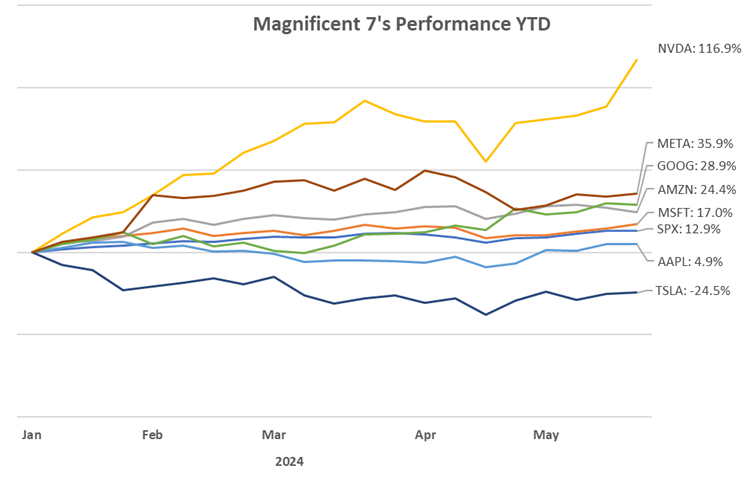
In addition, the “Magnificent 7,” comprising Apple, Alphabet, Amazon, Meta, Microsoft, Nvidia, and Tesla, have once again significantly bolstered the performance of the US equity market. According to J.P. Morgan, “Ex Mag-7, earnings growth for the remaining 493 names [of the S&P 500] in 2023 was on aggregate negative last year. Q1’24 marks the 5th quarter in a row when the S&P ex Mag-7’s earnings growth was negative.”16
Six of the seven “Magnificent 7” stocks have positively contributed to the S&P’s performance since the momentum period began in October 2023. In fact, 36% of the S&P’s 28.7% return during this period can be attributed to the Magnificent 7, while the top 10 largest names have contributed 49% of the Index’s positive performance. Collectively, as of quarter-end 3/31, the group constituted 31.3% of the S&P by market cap.
 Source: FactSet.
1Revenues are experiencing a 40% post-Covid second half weighted average, and 47% ten-year average.
2Factset.
3As of 5/24/24 using our own methodology with data from Factset.
4BCA Research
5National Bureau of Statistics.
6Factset.
7Total Guide represents the sum of companies that guided at least one of the following metrics: EPS, Revenue, EBITDA, Net Income, CapEx, Free Cash Flow, SS NOI, and Net Interest Income.
8Ibid.
9Factset.
10Weighted average EPS surprise for positive and negative surprises, and respective average share performance two months prior to earnings and five days after earnings.
11Earnings surprises broken down by positive and negative surprises for all 11 S&P sectors.
12Weighted average earnings and revenue growth.
13Factset.
14Positive guidance – raised in the quarter for the year or kept unchanged following a raise in the previous period. Negative guidance – lowered in the quarter or kept unchanged following a decrease in the previous quarter
15New period of momentum seen from week ending 4/26 to 5/24.
16J.P. Morgan.
Disclosures
This paper has been prepared by Consello MB LLC (“Consello”) for the party to whom it has been addressed and delivered and may not be used or relied upon for any purpose other than as specifically contemplated. This paper is based on information provided by or on behalf third parties, from public sources or otherwise reviewed by Consello. Consello assumes no responsibility for independent investigation or verification of such information and has relied on such information being complete and accurate in all material respects. To the extent such information includes estimates and forecasts of future financial performance or events, Consello has assumed that such estimates and forecasts are reasonable. No representation or warranty, express or implied, is made as to the accuracy or completeness of such information and nothing contained herein is, or shall be relied upon as, a representation, whether as to the past, the present or the future. This paper should not be considered a recommendation with respect to any matter. This paper has been developed by and is proprietary to Consello.
This paper was compiled on a confidential basis and not with a view to public disclosure or filing thereof under state or federal securities laws, and may not be reproduced, disseminated, quoted or referred to, in whole or in part, without the prior written consent of Consello.
This paper does not constitute an offer to sell or a solicitation of an offer to purchase any securities and is not a commitment by Consello (or any affiliate) to provide or arrange any financing for any transaction or to purchase any security in connection therewith. This paper may not reflect information known to other professionals in other business areas of Consello and its affiliates.
Consello and its affiliates do not provide legal, accounting or tax advice. Accordingly, any statements contained herein as to tax matters were neither written nor intended by Consello or its affiliates to be used and cannot be used by any taxpayer for the purpose of avoiding tax penalties that may be imposed on such taxpayer. Each person should seek legal, accounting and tax advice based on his, her or its particular circumstances from independent advisors regarding the impact of the transactions or matters described herein.
Broker-dealer services are provided through Consello Financial LLC (Member FINRA and SIPC).
Opinion and Belief; Forward-Looking Statements
Past performance is not necessarily indicative of future results. Certain statements contained in this paper may be based on current expectations, estimates, projections, opinions and beliefs of Consello. All views expressed and any statements relating to expectations regarding future events represent Consello’s own assessment and interpretation of information available to it as at the date of this paper. Such statements involve known and unknown risks, uncertainties and other factors, and undue reliance should not be placed thereon. Such statements represent solely the opinion or belief of Consello and are not expressed herein as the opinion or belief of any other entity or of members of the Consello team or other persons. No representation is made or assurance given that such statements or views are correct. Opinions expressed and other information or statements herein are subject to change without notice. Any discussion of general market activity, industry or sector trends, or other broad-based economic, market, political or regulatory conditions should not be construed as research or advice.
Additionally, this paper contains “forward-looking statements,” which can be identified by the use of terms such as “may”, “will”, “should”, “expect”, “anticipate”, “project”, “estimate”, “intend”, “see”, “continue,” “target,” “plan” or “believe” (or the negatives thereof) or other variations thereon or comparable terminology or forward-looking context. Furthermore, any projections or other estimates in this paper are “forward-looking statements” and are based upon certain assumptions that may change. Due to various risks and uncertainties, actual events may differ materially from those reflected or contemplated in such forward-looking statements. Moreover, actual events are difficult to project and often depend upon factors that are beyond the control of Consello and its affiliates. Recipients of this paper should not rely on such forward-looking statements, and no representation or warranty is made as to future events or results or such forward-looking statements. Nothing in this paper constitutes a guarantee, projection or prediction of future events or results.
Unless otherwise noted, information in this paper is presented as of the date hereof and does not reflect any facts, events or circumstances that may have arisen after that date, is subject to discussion, completion and amendment and does not contain all information necessary to fully evaluate any transaction. Neither Consello nor any other person has any obligation to update this paper (including forward-looking statements herein) or correct inaccuracies or omissions in it.
Copyright © 2024 Consello MB LLC. All rights reserved.