Q2 Earnings Season – Headline strength with uneven breadth
- Q2 delivered solid headline growth, but underlying performance was uneven. While as a whole, the aggregate of the S&P index posted healthy yearly earnings growth, ex-mega-cap earnings contracted, surprise magnitudes moderated, and dispersion across sectors widened.
- Beat breadth: With roughly 93% of S&P 500 companies having reported Q2 earnings, 59% of companies beat consensus revenue estimates and 76% beat on EPS (both consistent with recent averages).
- Surprise magnitude: Weighted upside versus expectations was more muted (revenue ~+1.3%, EPS ~+7.5%) as AI leaders came off four quarters of exceptional gains, leaving tougher comps and elevated bars that tempered the headline beat.
- Comparable growth: Growth held up year-over-year. Revenue increased 1.3% and EPS rose 9.8%, which is slightly below the double-digit pace of the prior two quarters, and continues to nudge the bar higher for the back half of the year.
- This dispersion reflects more than a “mega-cap effect.” Cyclical and several defensive groups continue to face earnings pressure from uneven demand, tariff pass-through, and FX. As a result, headline growth masks a more fragile underlying mix.
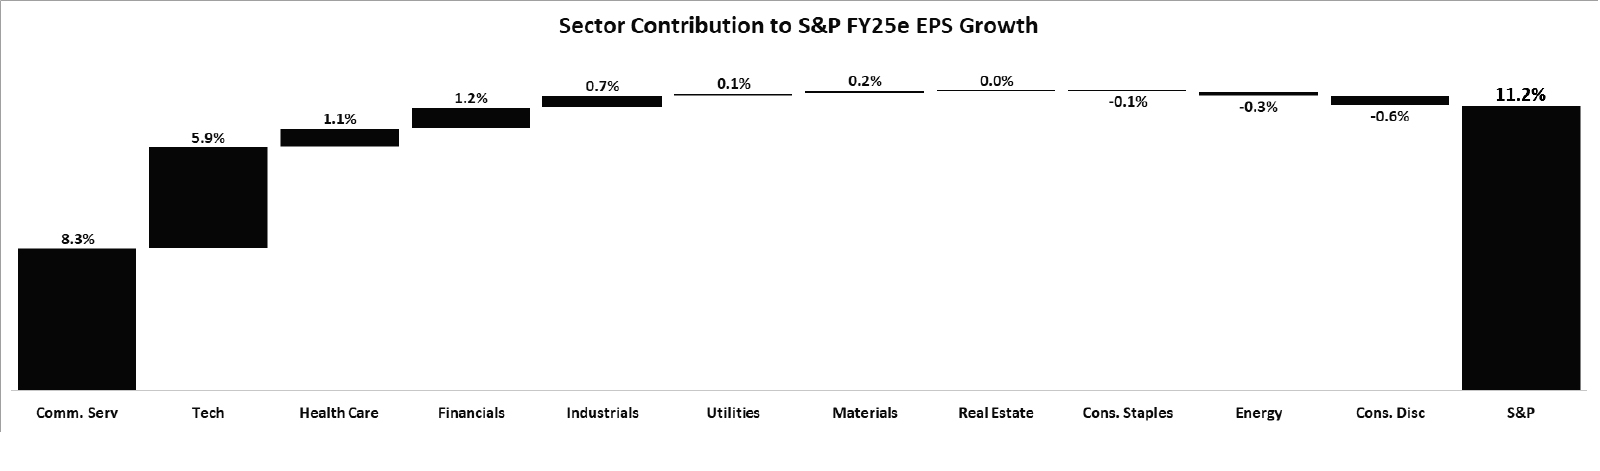
- Where the growth is and isn’t. Sector dispersion stayed pronounced.
- Sales leaders: Communication Services, Consumer Discretionary, and Utilities.
- Sales laggards: Technology and Energy.
- EPS leaders: Communication Services, Health Care, and Consumer Discretionary.
- EPS laggards: Energy and parts of Technology hardware and semiconductors.
- Guidance and the setup into 2H.
- For Q3, guidance leaned positive, with 67 companies raising full-year revenue outlooks versus 13 lowering, and 67 raising EPS guides versus 23 lowering.
- Street trajectory remains steady: mid-single-digit growth expected in Q3 and Q4 (7.2% and 7.0%), and 10.3% for full-year 2025.
- With indices near record highs and concentration still influential, management teams are threading the needle, relying on tight execution, pricing discipline, and productivity to support results in a high-expectations environment.
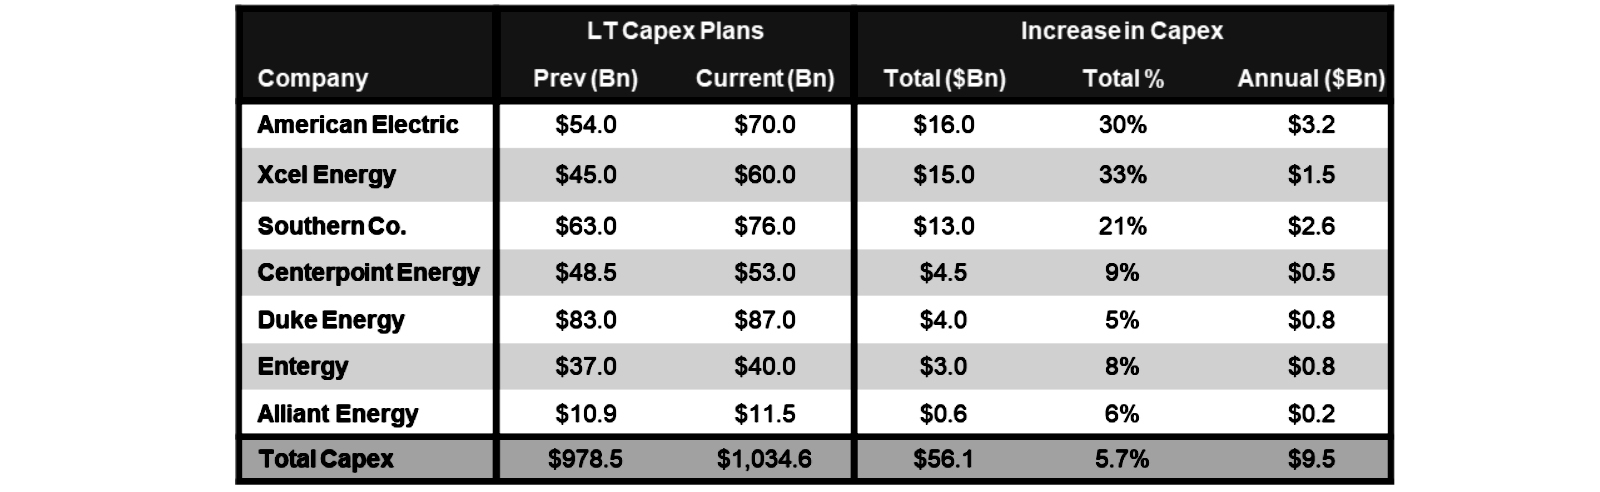
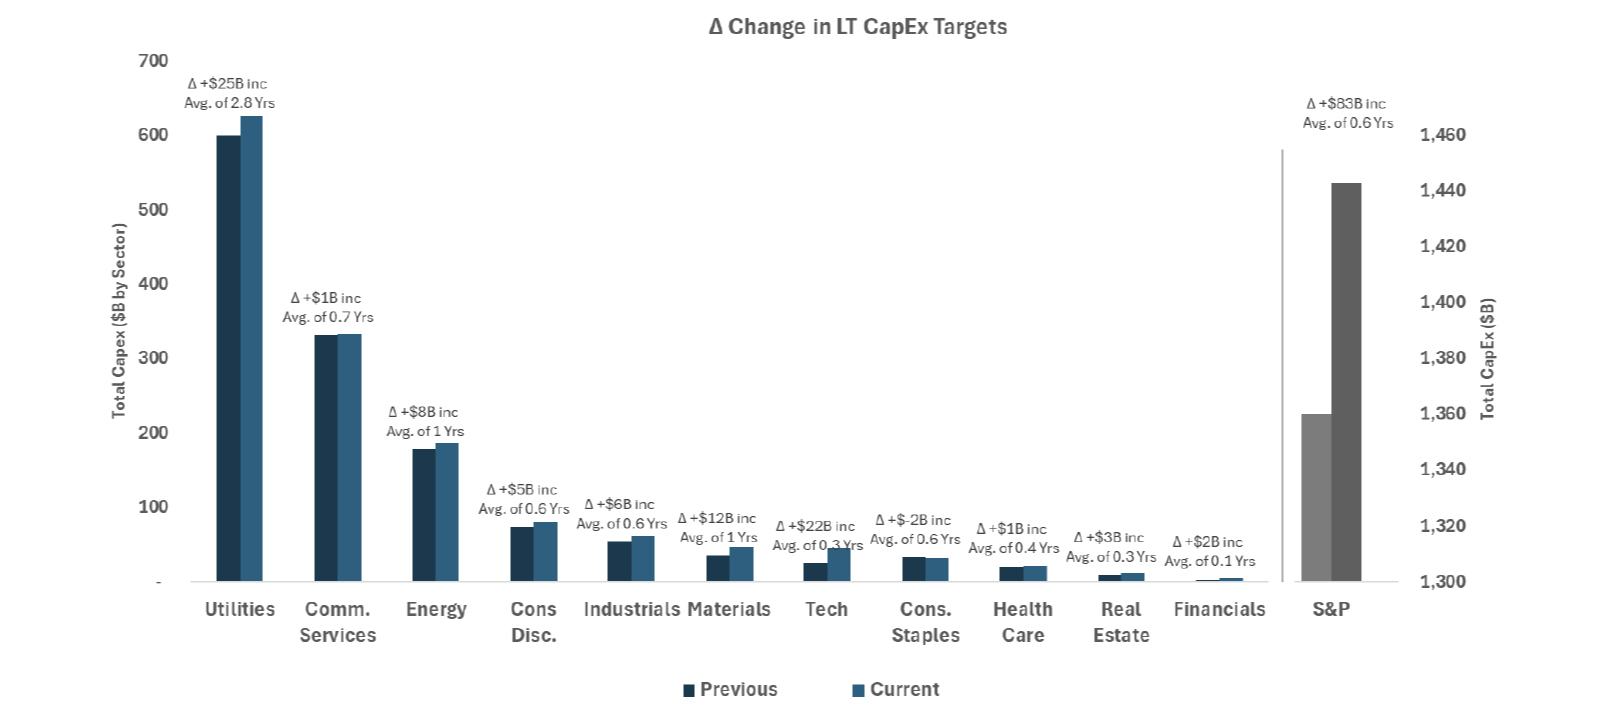
- An accelerated Capex wave emerging. A cross-sector roll-up shows aggregate long-term capex targets up more than $80B since the start of the year, with incremental increases across Technology, Energy, Industrials, and Materials, supported by OBBBA incentives and AI load visibility. Utilities led the way with ~$56B of incremental multi-year capex raised during Q2, earlier than typical, tied to AI-related power demand, grid hardening, and transmission build-out.
Bottom line. Q2 confirms the trend from Q1 – headline growth is intact, but market leadership is concentrated among mega-tech and AI names, and reactions to poor results remain unforgiving. The combination of solid beats, smaller surprise magnitudes versus historical five-year averages, and a constructive guidance skew sets a supportive backdrop for Q3. Delivery on strategic initiatives, sales and margin targets, along with guidance credibility, matter more than ever with the market starting from elevated valuations.
Summary of Q2 2025 Results – Headline gains with narrow breadth across the S&P 500
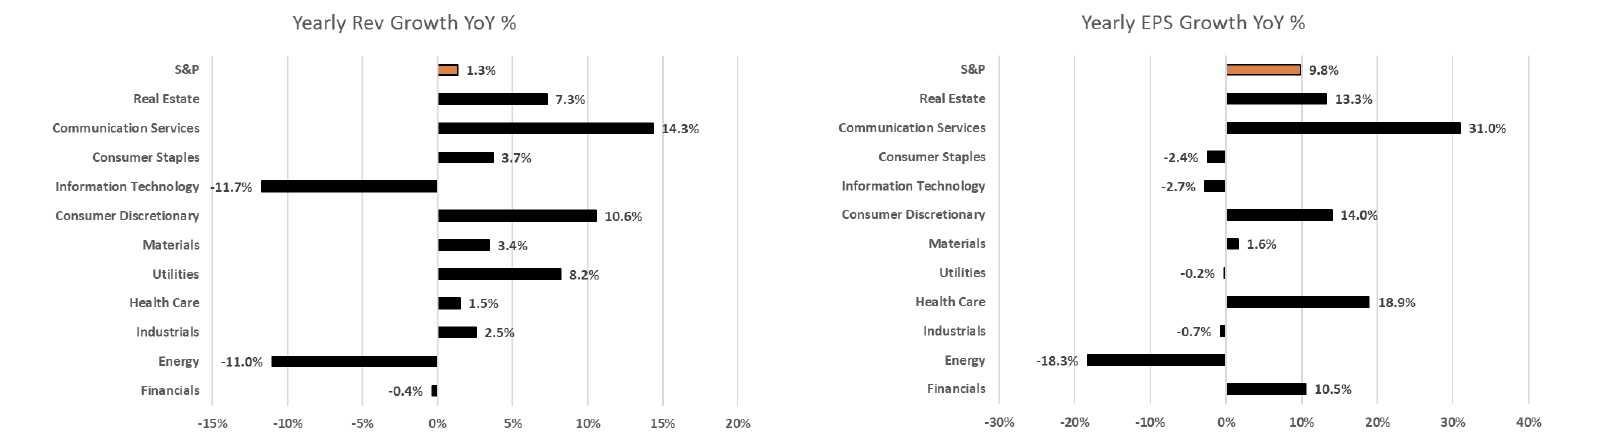
Q2 marked another quarter of earnings expansion for the S&P 500. Headline EPS rose 9.8% year-over-year and revenue increased 1.3%. Beneath the surface the picture is more bifurcated. Excluding the largest mega-caps, growth turned negative and dispersion widened, reinforcing how much index-level resilience still relies on a concentrated group of names.
The sector breakdown underscores this dispersion. EPS growth was led by Communication Services (+31.0%), Health Care (+18.9%), and Consumer Discretionary (+14.0%), while Energy (−18.3%) and Technology (−2.7%) lagged. On sales, Communication Services (+14.3%), Consumer Discretionary (+10.6%), and Utilities (+8.2%) led; Technology (−11.7%) and Energy (−11.0%) declined. The message is consistent with Q1: the index looks resilient, but breadth remains thin.
Source: FactSet; Consello analysis.
This dispersion reflects more than a “mega-cap effect.” Cyclical and several defensive groups continue to face earnings pressure from uneven demand, tariff pass-through, and FX. As a result, headline growth masks a more fragile underlying mix, which raises the bar for guidance credibility into Q3.
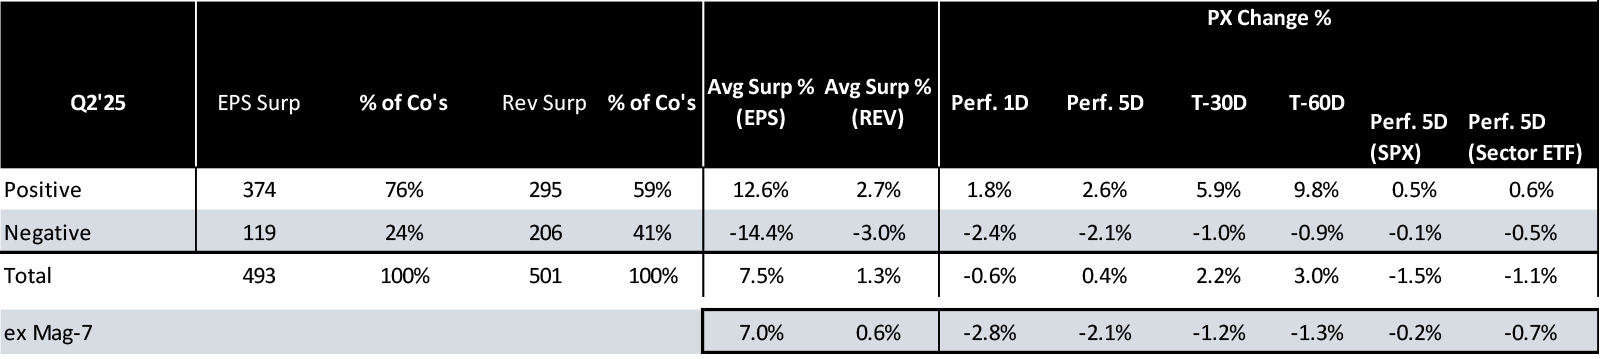
Subdued Revenue Growth with Significant Sector Dispersion. Top-line outperformance was subdued relative to cycle averages. 59% of companies beat revenue expectations, below the five-year and ten-year averages of 70% and 64%, respectively. Average revenue surprises were also subdued with Q2 seeing an average of ~1.3% positive surprise versus a five-year norm of 2.1% and in line with the ten-year average of 1.4% (excluding the “Magnificent 7,” EPS surprises were -4.3% year-over-year).1 Several large sectors posted year-over-year declines outside the largest constituents, with Technology and Energy the most notable drags, while Utilities and parts of Communication Services benefited from stable demand and pricing.
Beat rates were healthy but in line with recent norms. With roughly 93% of companies reported, 76% exceeded EPS expectations and 59% topped on revenue. Weighted upside was modest: EPS surprise averaged about +7.5% and revenue about +1.3%. Five-day performance after prints averaged +0.4% and masked wide dispersion between outperformers and underperformers. As has been the case in quarters past, negative surprises were punished more than positive surprises were rewarded.
Source: FactSet; Consello analysis.
Guidance and Revisions
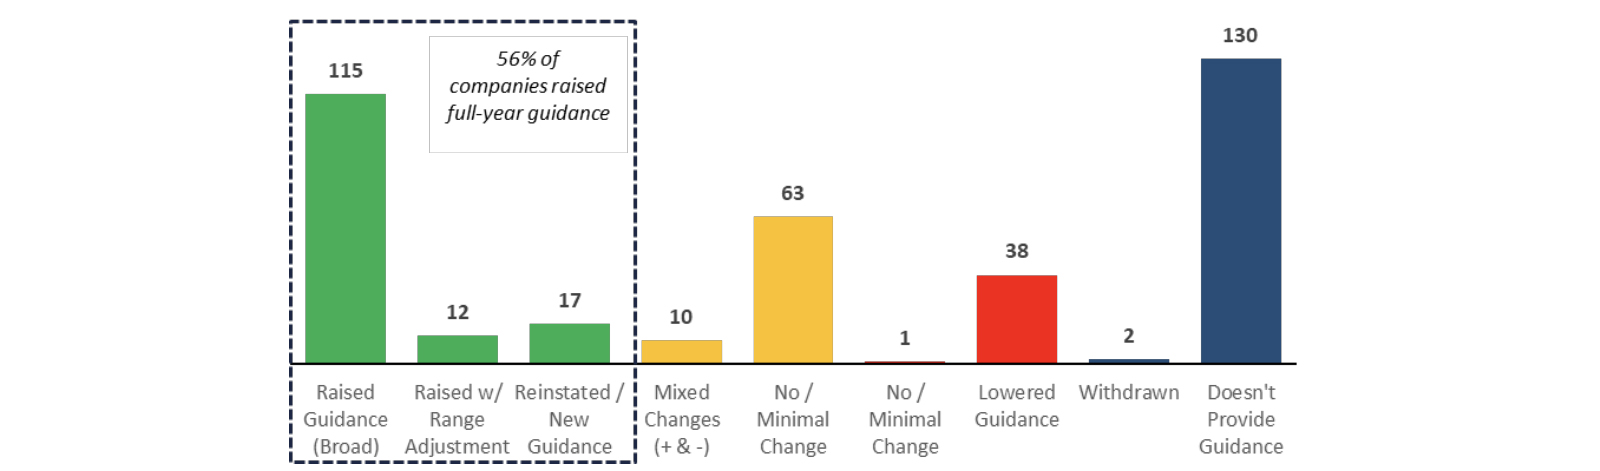
FY25 Guidance. As we discussed last quarter, Q1 volatility pushed management teams to rethink guidance. Many reset their frameworks by withdrawing or widening ranges, adding downside scenarios, and explicitly embedding tariff assumptions or quantifying impacts where they could. The uneven timing and direction of tariff announcements limited visibility, driving different approaches by sector and closer investor scrutiny. Nonetheless, during the Q2 quarter, ~56% of companies raised full-year outlooks, while ~11% lowered or withdrew them.
Source: FactSet.
Quarterly Guidance. For Q3, companies issuing guidance also skewed meaningfully positive with 67 companies issuing positive revenue outlooks (vs. consensus) versus 13 lowering, and 67 raising EPS guides versus 23 lowering.
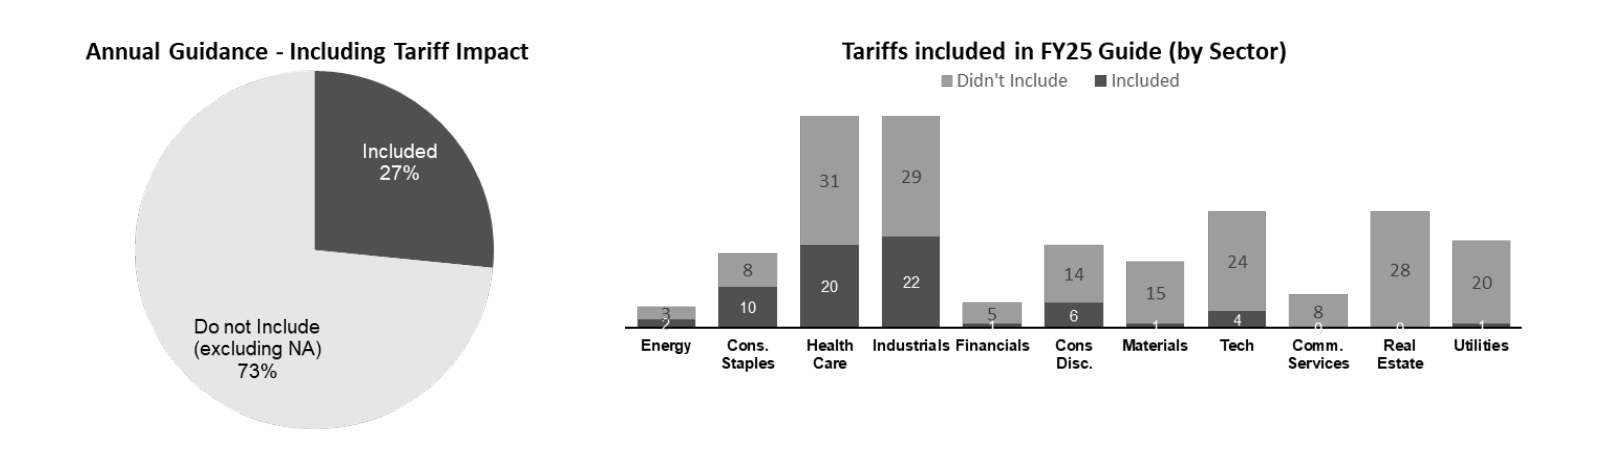
How Tariff Guidance has Evolved. Tariffs remained a prominent topic, especially during earnings call Q&A, but only a subset of companies quantified the impact in Q2. ~27% of companies included explicit tariff estimates in their FY25 guidance. Where numbers were provided, management framed the effect primarily through cost of goods sold (with selective pricing offsets); demand impacts were cited far less often. In aggregate, disclosed tariff headwinds are down roughly 50% for FY25, with an even smaller footprint expected in FY26 as companies rework supply chains and rely on pricing and pass-throughs to mitigate the burden.
Source: FactSet; Consello analysis.
Street trajectory remains steady. Mid-single-digit growth expected in Q3 and Q4 (7.2% and 7.0%), and 10.3% for full-year 2025.
Source: FactSet.
OBBBA / Reconciliation Bill takeaways – Why Corporates Are Constructive
The “One Big Beautiful Bill Act” (OBBBA), which was signed on July 4th, has increasingly been described by management teams as a source of adding clarity, including near‑term cash tax benefits (bonus depreciation and R&D expensing), clearer incentives for U.S. manufacturing/onshoring, and targeted industry support (defense procurement, select energy initiatives, and healthcare program funding).
- Certainty & confidence. A steadier budgeting backdrop even as policy negotiations continue.
- Tax & cash flow. Repeated references to permanent R&D expensing and bonus depreciation driving 2025 – 2026 cash tax relief.
- U.S. manufacturing / onshoring. Multiple examples of capacity adds linked to domestic content rules and credits.
- Sector‑specific stimulus. Defense and select energy verticals with the clearest first‑order benefits.
Our review of company earnings indicates OBBBA is starting to steer capital allocation and the cost of capital at the margin, with the clearest benefits in tax cash flows and rate-sensitive capex (table below).

Source: FactSet.
In practice, OBBBA is showing up in earnings remarks as improved after-tax cash flows and a stronger case for “build here,” particularly where tariff uncertainty intersects with supply chain risk.
Where it is landing first:
- Technology. Data-center power, cooling, and network backhaul are pulling spend forward. We are also seeing domestic siting for advanced packaging and component lines to shorten supply chains and secure power, often paired with utility interconnection agreements.
- Autos. Incremental EV and component capacity is being committed in North America to avoid multinational tariff frictions and to qualify under regional content rules. Several programs explicitly cite “local-for-local” as the operating model.
- Health Care. Manufacturers are shifting toward U.S. or USMCA-compliant footprints to reduce cross-border complexity and improve resilience. More plants are being tooled for U.S. demand with emphasis on validated, redundant lines.
Special Topic: The capex wave is building
Q2 is showing an atypical mid-year step-up in capex intentions (relative to previous capex cycle inflection points) and multi-year investments. The increase was largely led by Utilities and increasingly supported by Technology and Industrials supply chains. OBBBA provided the planning clarity; AI demand and expected tariff impact provided the urgency. The story from here is less about whether capex is rising and more about the speed at which it turns into steel in the ground and earnings power.
Utilities moved first and they moved early. During Q2, a group of the largest utilities lifted multi-year plans by roughly $56 billion versus Q4 (a ~6% rise in total Capex guides), which is unusual timing given how rarely companies raise capex mid-year. The rationale is straightforward: rising baseload from AI data centers, grid hardening and reliability, and the transmission build needed to connect new load and generation. Several management teams paired larger totals with longer execution windows, signaling that this is not a one-quarter adjustment but the start of a multi-year program.
Source: Factset, Consello analysis.
The signal from management teams is consistent: demand visibility has improved enough to justify committing capital, and the base rate or cash-flow path is clearer than it was in Q1. Utilities and the large hyperscalers will continue to anchor dollar totals (in a regulated rate base environment), while Technology and selected Industrials supply chains will likely supply the urgency. Energy’s increases skew to reliability and export infrastructure rather than volume growth, and Communications Services looks more incremental, focused on network readiness over large new programs.
Source: Factset, Consello analysis.
Market & Policy Backdrop
Against a backdrop of greater policy clarity on S&P 500 capex and a market that had largely priced in a first 2025 rate cut, corporate commentary continues to center on execution, cost control, and capital discipline.
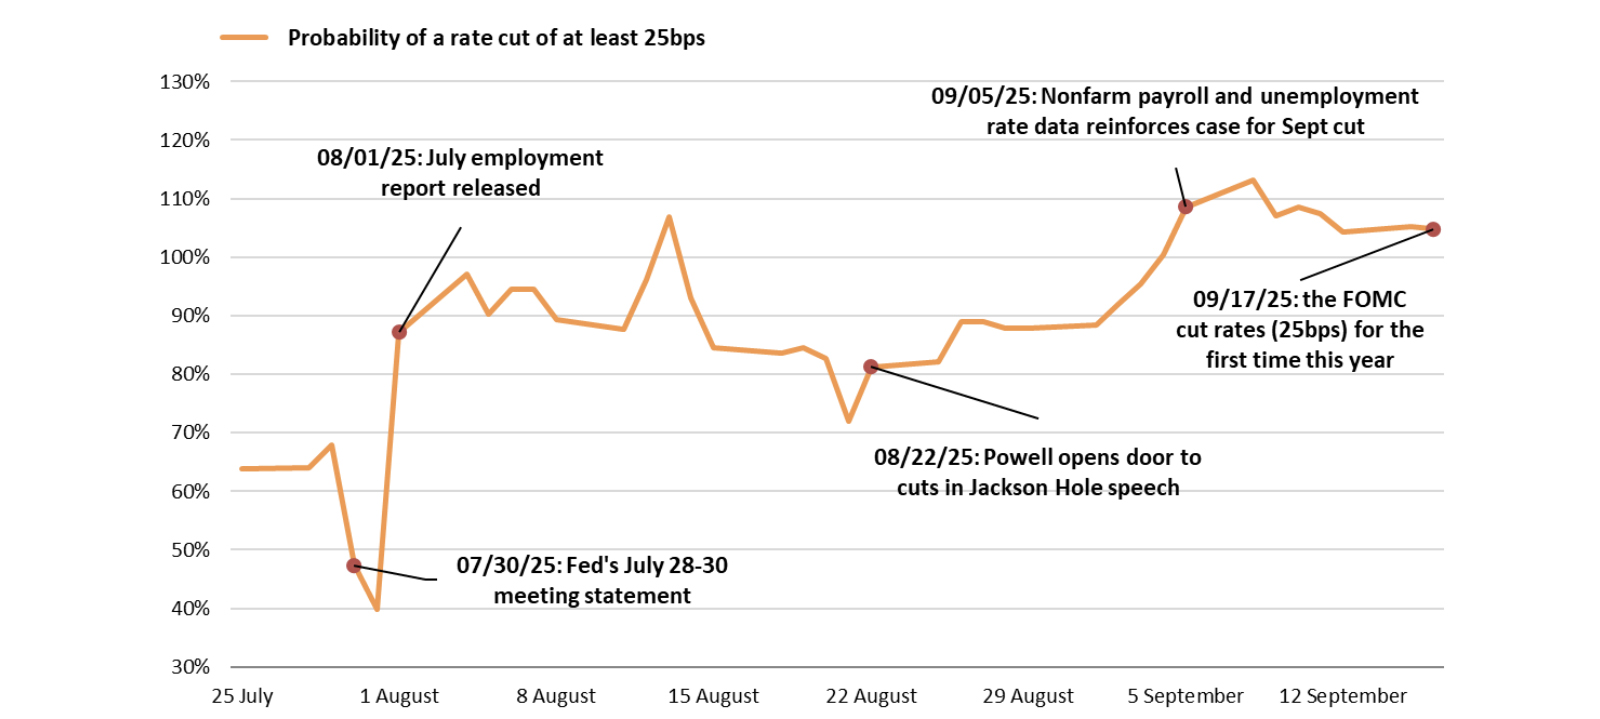
- Post-Jackson Hole set-up: Following the Jackson Hole symposium, expectations for a September rate cut surged; a week before the meeting, markets were effectively pricing a 25 bps cut, which is what the Fed delivered on Sept. 17 with its first rate cut of the year.
- Following the FOMC’s announcement, Chair Powell framed the move as a risk-management cut, emphasizing data dependence and balance-of-risks language from the statement and presser. Markets finished mixed/near flat following the announcement.
- Probability & pricing: As of Sept. 18, markets assign ~92% odds to another 25 bps cut in October (implying one additional move, not more). The new dot plot/SEP skews toward two additional cuts in 2025, reinforcing the near-term easing path.
- Index levels. All three major indices reached record levels during the month of August (the S&P notched a record for the third consecutive month, while the Nasdaq notched its highest level for the fourth straight month). Interestingly, during July, the S&P 500 didn’t have any significant moves of 1% in either direction, which hasn’t happened since July 2023.2 On Sept. 17, stocks were mixed (with the Dow up and S&P/Nasdaq closing marginally softer); this was largely consistent with a well-telegraphed move and “wait-for-data” guidance.
- Earnings leadership remains AI‑heavy, but participation broadened modestly through August/September as rate path uncertainty eased.
Fed Rate Cut Probabilities
Source: Factset, Consello analysis.
1The Magnificent 7 includes Amazon, Alphabet, Apple, Meta, Microsoft, Nvidia and Tesla.
2Nasdaq.
Disclosures
This paper has been prepared by Consello MB LLC (“Consello”) for the party to whom it has been addressed and delivered and may not be used or relied upon for any purpose other than as specifically contemplated. This paper is based on information provided by or on behalf third parties, from public sources or otherwise reviewed by Consello. Consello assumes no responsibility for independent investigation or verification of such information and has relied on such information being complete and accurate in all material respects. To the extent such information includes estimates and forecasts of future financial performance or events, Consello has assumed that such estimates and forecasts are reasonable. No representation or warranty, express or implied, is made as to the accuracy or completeness of such information and nothing contained herein is, or shall be relied upon as, a representation, whether as to the past, the present or the future. This paper should not be considered a recommendation with respect to any matter. This paper has been developed by and is proprietary to Consello.
This paper was compiled on a confidential basis and not with a view to public disclosure or filing thereof under state or federal securities laws, and may not be reproduced, disseminated, quoted or referred to, in whole or in part, without the prior written consent of Consello.
This paper does not constitute an offer to sell or a solicitation of an offer to purchase any securities and is not a commitment by Consello (or any affiliate) to provide or arrange any financing for any transaction or to purchase any security in connection therewith. This paper may not reflect information known to other professionals in other business areas of Consello and its affiliates.
Consello and its affiliates do not provide legal, accounting or tax advice. Accordingly, any statements contained herein as to tax matters were neither written nor intended by Consello or its affiliates to be used and cannot be used by any taxpayer for the purpose of avoiding tax penalties that may be imposed on such taxpayer. Each person should seek legal, accounting and tax advice based on his, her or its particular circumstances from independent advisors regarding the impact of the transactions or matters described herein.
Broker-dealer services are provided through Consello Financial LLC (Member FINRA and SIPC).
Opinion and Belief; Forward-Looking Statements
Past performance is not necessarily indicative of future results. Certain statements contained in this paper may be based on current expectations, estimates, projections, opinions and beliefs of Consello. All views expressed and any statements relating to expectations regarding future events represent Consello’s own assessment and interpretation of information available to it as at the date of this paper. Such statements involve known and unknown risks, uncertainties and other factors, and undue reliance should not be placed thereon. Such statements represent solely the opinion or belief of Consello and are not expressed herein as the opinion or belief of any other entity or of members of the Consello team or other persons. No representation is made or assurance given that such statements or views are correct. Opinions expressed and other information or statements herein are subject to change without notice. Any discussion of general market activity, industry or sector trends, or other broad-based economic, market, political or regulatory conditions should not be construed as research or advice.
Additionally, this paper contains “forward-looking statements,” which can be identified by the use of terms such as “may”, “will”, “should”, “expect”, “anticipate”, “project”, “estimate”, “intend”, “see”, “continue,” “target,” “plan” or “believe” (or the negatives thereof) or other variations thereon or comparable terminology or forward-looking context. Furthermore, any projections or other estimates in this paper are “forward-looking statements” and are based upon certain assumptions that may change. Due to various risks and uncertainties, actual events may differ materially from those reflected or contemplated in such forward-looking statements. Moreover, actual events are difficult to project and often depend upon factors that are beyond the control of Consello and its affiliates. Recipients of this paper should not rely on such forward-looking statements, and no representation or warranty is made as to future events or results or such forward-looking statements. Nothing in this paper constitutes a guarantee, projection or prediction of future events or results.
Unless otherwise noted, information in this paper is presented as of the date hereof and does not reflect any facts, events or circumstances that may have arisen after that date, is subject to discussion, completion and amendment and does not contain all information necessary to fully evaluate any transaction. Neither Consello nor any other person has any obligation to update this paper (including forward-looking statements herein) or correct inaccuracies or omissions in it.
Copyright © 2025 Consello MB LLC. All rights reserved.