S&P 500 Q4 2024 Earnings Report: A Strong Quarter Amid Mixed Market Sentiment
Key Q4 2024 Insights
- Earnings Growth: The S&P 500 is tracking an 18.7% YoY EPS growth rate, which would mark the highest growth since 2021 and the sixth consecutive quarter of earnings expansion.1 77% of S&P 500 companies have reported a positive EPS surprise in Q4 2024.
- Revenue Performance: The blended YoY revenue increase for the S&P 500 is 10.3%. 59% of companies exceeded sales expectations, though the magnitude of revenue beats remains below historical averages.
- Excluding the “Magnificent 7”, YoY growth for the broader index was -0.5% for EPS and 1.7% for
revenue.2
- Excluding the “Magnificent 7”, YoY growth for the broader index was -0.5% for EPS and 1.7% for
- Market Reaction to Earnings:
- Positive surprises led to an average +1.9% same-day stock gain (vs. +1.0% five-year average).
- Negative surprises resulted in a -3.0% drop (worse than the -2.3% five-year average).
- Over five days, stocks with positive surprises gained +2.2%, while negative surprises declined -3.8%.
- Guidance Trends: With 95% of the S&P 500 reporting, 309 companies (61%) have provided guidance:3
- Annual Guidance Trends: 51% (258 companies) have issued FY25 EPS guidance, with 39% (198 co’s) raising projections, 9% (46 co’s) lowering them, and 3% (13 co’s) keeping guidance unchanged.
- Q1 Guidance: 55 S&P 500 companies (57%) have issued negative EPS guidance, and 40 S&P 500 companies (42%) have issued positive EPS guidance.
- The percentage of companies issuing negative EPS guidance is in line with the five-year average (58%), but below the ten-year average (62%).
- Financials and Energy saw the most positive guidance, while Real Estate and Consumer Staples issued the highest number of downward revisions.
- Tariff policy sparked market volatility during Q4 earnings season, but most S&P 500 companies remained
muted in their responses.- Despite heightened investor focus on trade uncertainty, 59% of S&P 500 companies did not mention
tariffs at all during their Q4 earnings calls. An additional 35% acknowledged tariffs but either noted no expected impact on full-year 2025 EPS guidance or indicated it was too early to assess potential effects. - Given the additional uncertainty on tariff implications, sell-side analysts have responded with
significantly wider FY25 EPS estimate ranges—3.4x broader than the ranges provided in company issued guidance—signaling elevated uncertainty priced into forecasts (See page 6 for more detail).
- Despite heightened investor focus on trade uncertainty, 59% of S&P 500 companies did not mention
Summary of 2024 Results – S&P 500 Earnings Growth Hits Three-Year High Amid Mixed Revenue Performance
With 95% of companies having reported, S&P 500 companies are delivering solid results, with earnings growth reaching its highest level since 2021.4 While the percentage of companies reporting positive earnings surprises is slightly below the five-year average, it remains in line with the ten-year trend. The magnitude of earnings surprises is also broadly consistent with historical norms. Revenue performance, however, has been weaker, with fewer companies exceeding estimates and the magnitude of revenue surprises falling below both five-year and ten-year averages. Despite this, the S&P 500 has recorded its sixth consecutive quarter of YoY earnings growth and its 17th straight quarter of revenue expansion, signaling continued resilience across most sectors.
However, market sentiment remains cautious, with investors weighing macroeconomic risks against earnings strength. Companies that missed expectations saw steeper declines than usual, while positive surprises were rewarded less than historical norms. This suggests that investors are taking a selective approach amid economic uncertainty.
Trade policy is becoming an emerging factor in earnings calls, particularly in Industrials, Materials, and Health Care. However, only 6% of companies explicitly quantified tariffs in their guidance, indicating that most firms remain hesitant to embed trade policy uncertainty into projections.
Percentage of Companies Beating Earnings Estimates (77%) is in Line with the Five-Year Average
Overall, 77% of companies who have reported within the Q4 2024 earnings season have reported actual annual EPS above estimates, which is in line with the five-year average of 77% and slightly above the ten-year average of 75%. Overall, companies have reported earnings 7.5% above consensus (5.2% if we exclude the “Magnificent 7”), which is below the five-year average of 8.5% but above the ten-year average of 6.7%. The Health Care, Technology, and Financials sectors each saw 85% of companies beat earnings estimates.
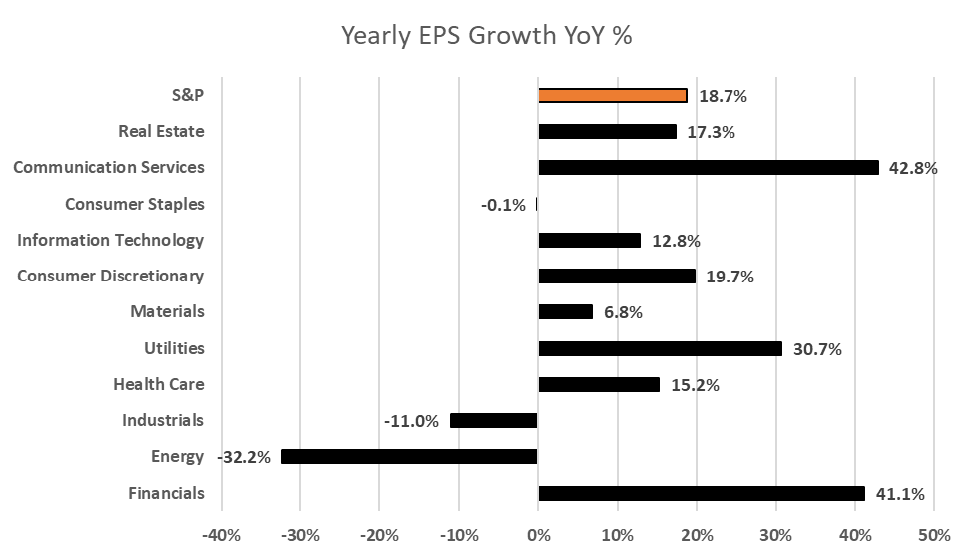
The weighted average earnings growth rate for the S&P 500 is 18.7%, which will mark the highest YoY earnings growth rate reported by the index since 2021 (31.4%). Excluding the ”Magnificent 7”, YoY earnings growth for the broader
index was -0.5%.
Eight of the eleven sectors reported earnings growth in 2024, with seven reporting double-digit growth (led by
Communication Services +43%, Financials +41%, and Consumer Discretionary +20%). Conversely, Energy (-32%) and
Industrials (-11%) reported a YoY decline in earnings.
Source: FactSet5
Revenues Surprises and Magnitude of Beats Have Been Muted for Q4
In terms of revenues, 59% of S&P 500 companies have reported actual revenues above estimates, which is below the five-year average of 69% and below the ten-year average of 64%. Companies reported revenues that are 1.3% above estimates (1.1% ex-“magnificent 7”), which is below both the five-year average of 2.1% and the ten-year average of 1.4%. At the sector level, the Technology sector saw the highest percent of companies (81%) beat sales estimates, followed by Health Care (77%).
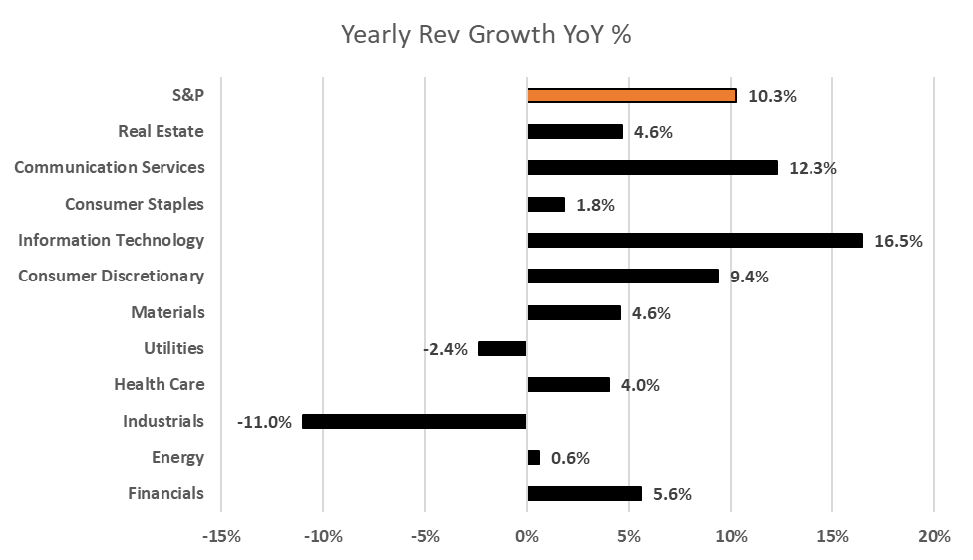
The blended revenue growth rate for 2024 is 10.3%, which is the 17th consecutive quarter of revenue growth for the Index. As has been the case for much of the last two years, if the tech-laden “Magnificent 7” companies6 are excluded, the S&P’s Q4 sales growth increased by only 1.7% using our weighted average methodology.7
Nine of eleven sectors reported YoY growth in revenue, led by the Technology (+17%) and Communication Services (+12%) sectors. On the other hand, Industrials (-11%) and Utilities (-2%) are the only two sectors that have reported YoY declines in revenue throughout 2024.
Source: FactSet8
Market Rewarding Positive EPS Surprises Less Than Average
The market is rewarding positive earnings surprises reported by S&P 500 companies for Q4 less than average and punishing negative earnings surprises reported by S&P 500 companies for Q4 more than average.
Companies issuing positive earnings surprises saw their stocks rise +1.9% on earnings day, slightly above the five-year average (+1.0%). In contrast, negative earnings surprises led to a -3.0% decline, a larger drop than the historical -2.3% average. This trend continued over a five-day period, with stocks reporting positive surprises gaining an average of 2.2%, while those missing expectations declined an average of -3.8%.
Navigating Tariff Uncertainty: How Companies Are Responding to Shifting Trade Policy
Despite positive corporate performance during this earnings cycle, broader market sentiment has remained cautious, as investors balance strong corporate earnings growth against a backdrop of mounting macroeconomic concerns. Mixed economic data and persistent inflation pressures have raised new questions about the durability of the post-pandemic recovery. Growth expectations have softened following disappointing economic indicators, while inflation remains elevated, complicating the Federal Reserve’s policy outlook.
Adding to the uncertainty are the new administration’s proposed changes to trade, immigration, taxation, and foreign policy, particularly regarding Ukraine. Meanwhile, the Federal Reserve has maintained a cautious tone, citing the need for additional clarity on inflation trends and broader economic conditions before committing to policy adjustments.9
Trade policy has emerged as a major market overhang, as the Trump administration announced new tariffs on Canada, Mexico, and China. While their implementation has been temporarily delayed for negotiations, concerns remain about supply chain disruptions, cost inflation, and broader economic implications. The uncertainty surrounding these policies has contributed to declining consumer confidence, which in February saw its largest monthly drop since August 2021.
A brief YTD timeline of proposed and implemented tariffs and the S&P 500’s response is outlined below:
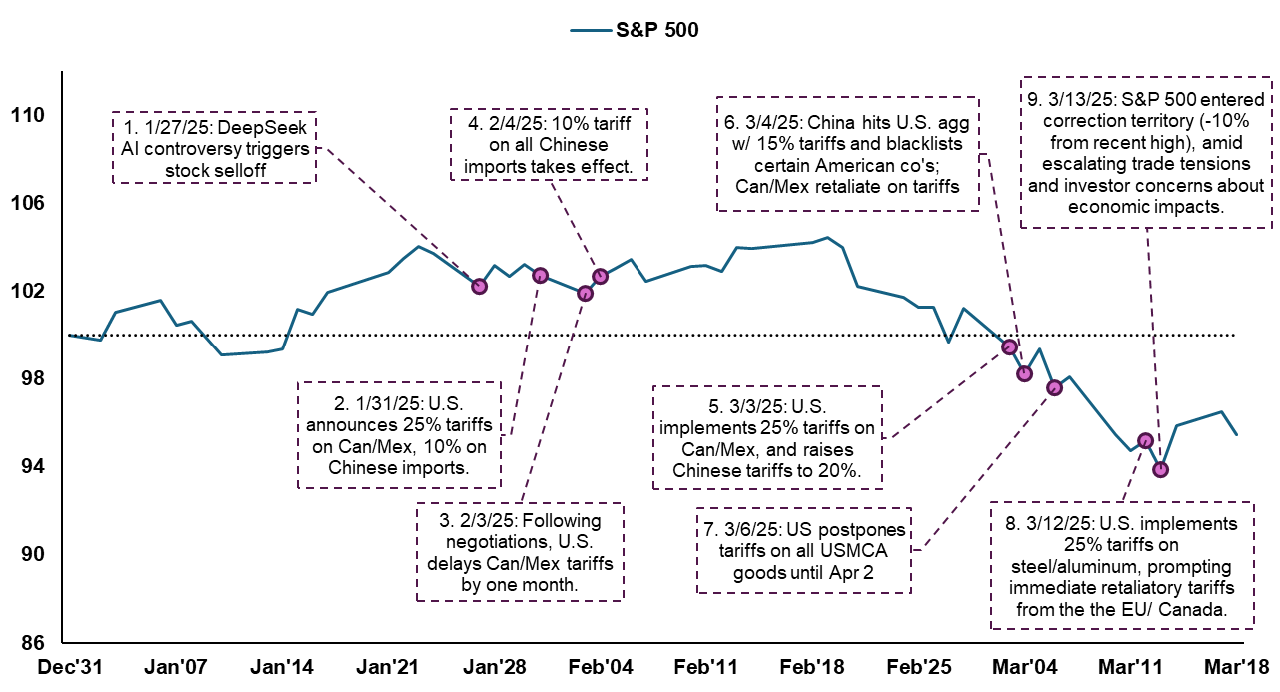
Source: FactSet
Tariffs & Corporate Earnings (EPS) Guidance:
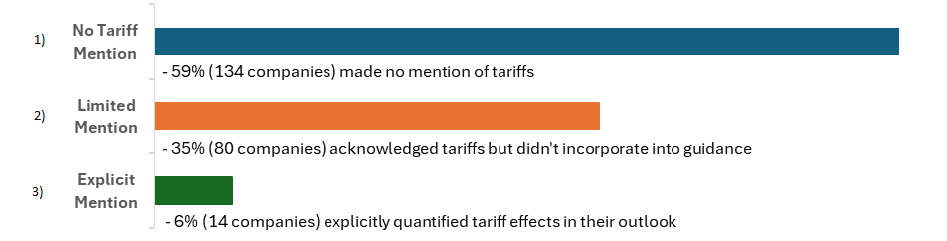
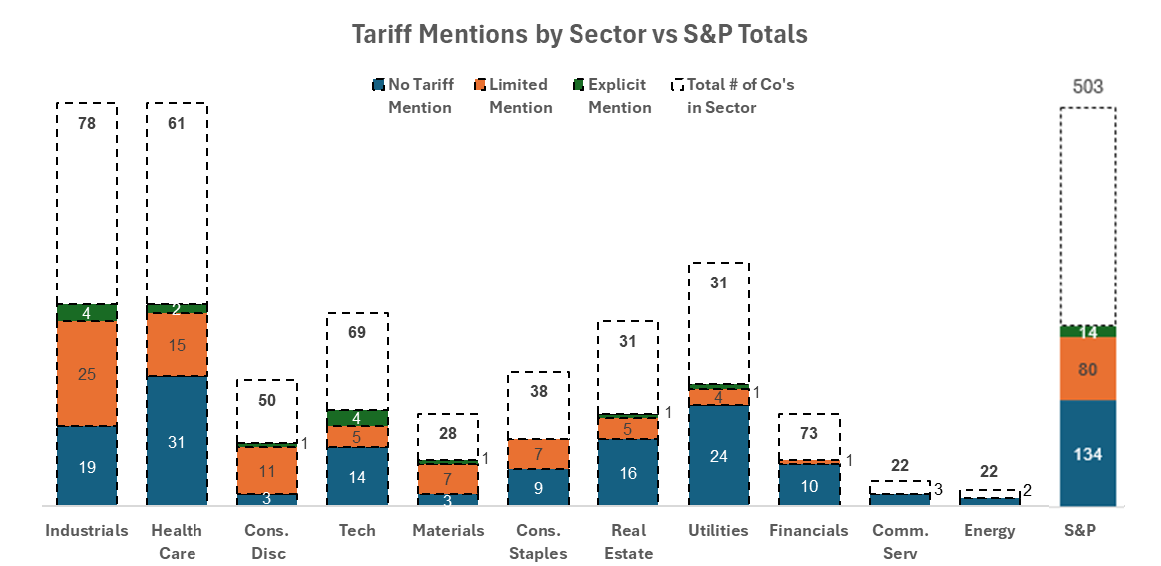
While tariffs have not dominated earnings discussions, they have become an emerging concern for companies with global supply chain exposure. To assess the broader market impact among the 258 S&P 500 companies issuing FY25 EPS guidance, Consello analyzed S&P 500 earnings transcripts, identifying three distinct approaches to tariff discussions:
Source: FactSet
Sector-Level Trends & Notable Omissions
From a sector perspective, Industrials, Materials, and Health Care had the highest degree of tariff mentions on earnings calls—with 37% of Industrials, 29% of Materials, and 18% of Health Care companies acknowledging tariff risks. However, only a small subset quantified the financial impact in their guidance.
Meanwhile, the “Magnificent 7” tech giants (Amazon, Tesla, Meta, Alphabet, Apple, Microsoft, Nvidia), which now constitute 35% of the S&P 500’s market cap, did not provide 2025 EPS guidance, and most avoided tariff discussions altogether. Apple briefly acknowledged the issue, stating only: “We are monitoring the situation and don’t have anything more to add than that.”
Source: FactSet
How Tariff Uncertainty Is Affecting 2025 EPS Guidance for the S&P 500
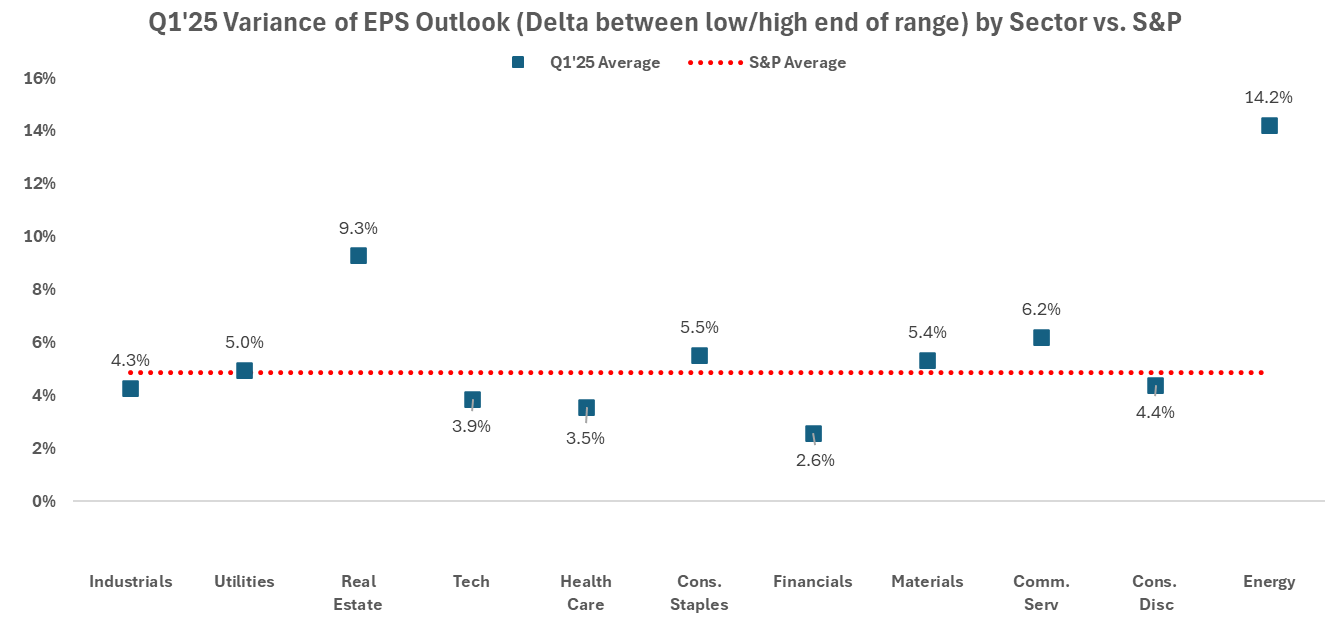
To assess how companies incorporated tariff uncertainty into 2025 earnings guidance, Consello analyzed the historical variance between low and high EPS estimates on a quarterly basis since 2017. This provides a direct comparison between past tariff-heavy environments (e.g., 2018 Trump tariffs) and the current landscape.
Typically, as the year progresses, companies refine their full-year forecasts, leading to narrowing full-year EPS estimate ranges. On average over the last eight years, the full-year EPS spread between low and high estimates starts at $0.27 in Q1 and declines to $0.19 by Q4, reflecting increased clarity over time.
However, in Q1, the average full-year 2025 EPS range has widened to $0.33, signaling greater uncertainty.
Tariff Transparency & EPS Variability: Segmenting companies by tariff transparency reveals meaningful differences:
- Companies that avoided discussing tariffs had an average EPS variance of 4.8%.
- Those that acknowledged tariffs but did not include them in guidance saw a 5.1% variance.
- Companies that explicitly factored in tariffs had the widest spread at 5.9%.
Sector-Level Breakdown: Certain industries exhibited notably wider EPS guidance ranges:
- Energy: 14.2% variance ($0.52 EPS range) – the highest among all sectors.
- Real Estate: 9.5% variance ($0.20 EPS range).
- Communication Services: 6.2% variance ($0.16 EPS range).
Source: FactSet
Key Takeaway: These deviations indicate that, while some level of uncertainty has always existed in several sectors, tariff concerns have added a further layer of unpredictability, particularly in industries reliant on international supply chains and imported materials. However, the divergence across industries suggests that market sentiment around tariffs is highly sector-dependent, with some industries seen as better positioned to absorb trade-related volatility than others.
How Has the Sell-Side Modeled Tariff Uncertainty?
Sell-side analysts have also adjusted their full-year EPS modeling assumptions to reflect heightened tariff uncertainty, though the overall impact on long-term earnings expectations remains limited.
- The spread between low and high FY25 EPS estimates across S&P 500 companies has expanded to $1.46—3.4x larger than the average range provided by company management ($0.33 vs. $1.46).
- Companies that explicitly quantified tariff impacts have seen the widest analyst EPS estimate spreads ($2.00 average), while those that avoided discussing tariffs had much smaller ranges ($1.07 average).
- Amongst specific sectors, Energy companies have the widest EPS estimate ranges ($3.85 variance), followed by Consumer Discretionary ($2.81 variance), likely reflecting greater supply chain and commodity price uncertainty.
Key Takeaway: While sell-side analysts have adjusted their assumptions, the overall increase in uncertainty remains modest, suggesting that most are viewing tariffs as a near-term risk rather than a structural shift.
Guidance Trends: Positive Signals Amid Slight EPS Growth Revisions
Quarterly Guidance: 23% of S&P 500 companies that have reported Q4 2024 results have issued Q1 2025 guidance, which is in line with previous quarters.
- EPS: For Q1, 55 S&P 500 companies (57%) have issued negative EPS guidance, and 40 S&P 500 companies (42%) have issued positive EPS guidance. The percent of companies issuing negative EPS guidance is in line with the five-year average (58%), but below the ten-year average (62%).
- Revenue: 36 S&P 500 companies (45%) have issued negative revenue guidance, and 42 S&P 500 companies (53%) have issued positive revenue guidance.
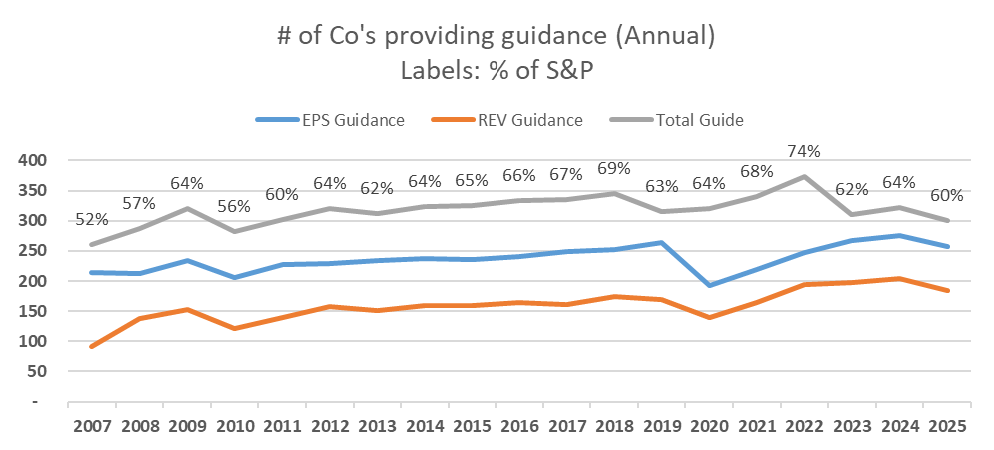
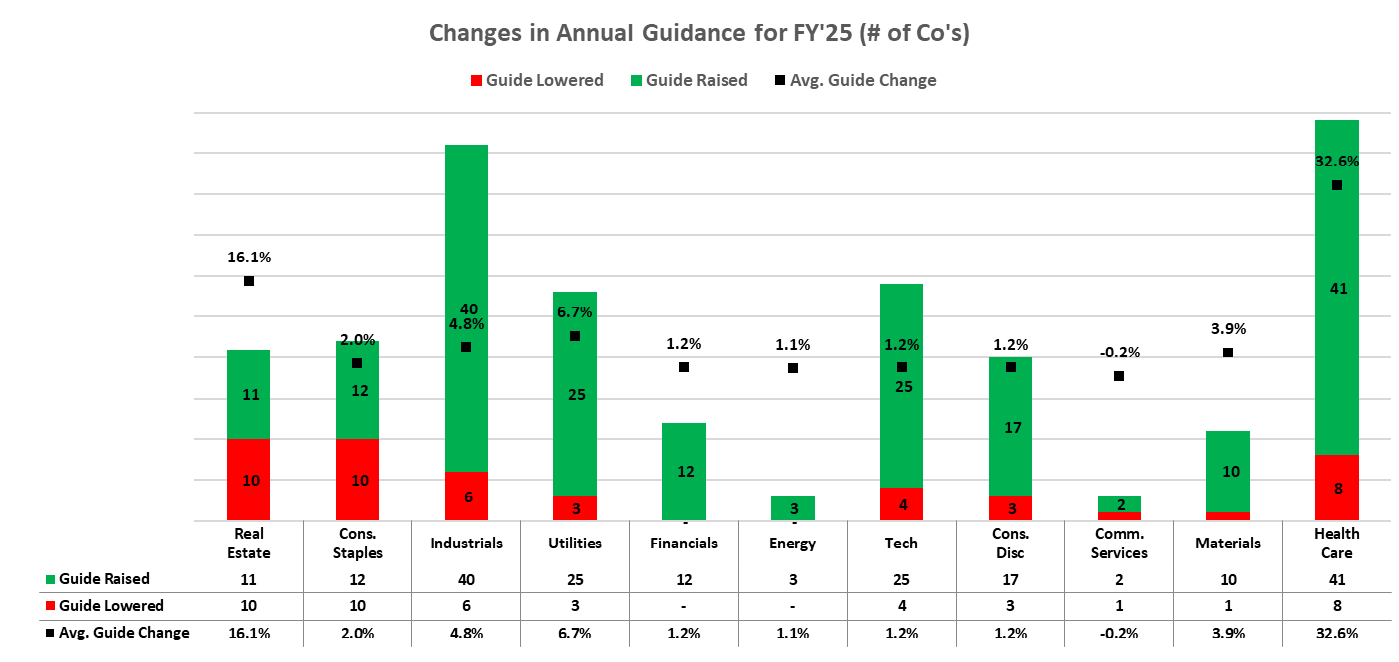
FY 2025 Guidance: 309 companies10 (61% of the S&P) have provided any sort of guidance, while 258 companies (51% of the S&P) have provided FY’25 EPS guidance.11 Of these, 198 companies (39%) have issued earnings guidance that is higher for FY’25 than they were for FY’24, 13 companies (3%) have issued earnings guidance that is the same for FY’25 as they were for FY’24, and 46 companies (9%) have issued earnings guidance lower than FY’24.
Source: FactSet
Among sectors, 100% of companies within the Financial and Energy sectors raised earnings guides for FY’25. 45% of Real Estate and 33% of Consumer Staples companies lowered their earnings outlook compared to FY’24.
Source: FactSet
Overall, consensus FY 2025 S&P 500 EPS growth is now projected at 11.6%, with growth contribution expected to be driven by the Communication Services, Tech and Health Care sectors.
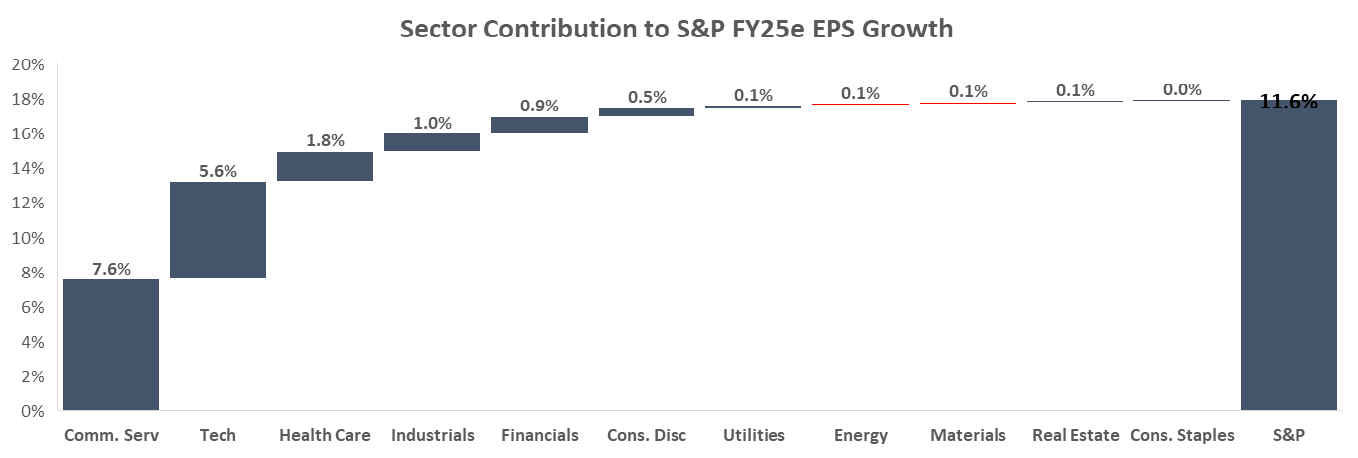
Source: FactSet12
1Factset.
2Companies like Amazon (Q4 2024 EPS grew 86%) and Nvidia (EPS grew 72% YoY) have outsized impacts given their market cap. These two companies alone represent 10% of the S&P by market cap.
3Total Guide represents the sum of companies that guided at least one of the following metrics: EPS, Revenue, EBITDA, Net Income, CapEx, Free Cash Flow, SS NOI, and Net Interest Income.
4Ibid.
5Weighted average EPS and revenue growth.
6The Magnificent 7 includes Microsoft, Amazon, Nvidia, Alphabet, Google, Tesla, and Meta.
7After taking out the Magnificent 7 (~33% of the S&P by weight as of December 31), we re-weighted the other constituents of the S&P.
8Some companies have outsized impacts on these weighted growth metrics. For example, Nvidia makes up ~6.1% of the S&P by market cap and saw EPS growth of 72%. As a result, the company contributed ~27% of the S&P’s 18.7% YoY EPS growth.
9On March 19, the Federal Reserve held the Fed Funds rate steady while raising its 2025 inflation outlook. However, it maintained its projection of two rate cuts by year-end, signaling optimism despite persistent price pressures.
10As of 3/06/25 using our own methodology with data from Factset. These include a total of 503 companies within the S&P, and factor in companies that do not provide any guidance (in addition to companies with unchanged, positive/raised, and negative/lowered guidance).
11For overall metrics, we consider whether a company gives guidance for any of EPS, revenue, EBITDA, net income, net operating income, or net interest income. However, for the more detailed analysis, we only look at EPS and revenue figures.
12Numbers on the chart reference the expected Street (using Factset Consensus) growth rates for each subsector ETF (using SPDR ETFs) multiplied by the sector weight within the S&P 500. For example, the Communication Services sector is 13.0% of the S&P 500 by market weight, and Street estimates for 2025 Earnings Growth are 57.0%, meaning the sector’s contribution to the S&P as a whole is 7.6%.
Disclosures
This paper has been prepared by Consello MB LLC (“Consello”) for the party to whom it has been addressed and delivered and may not be used or relied upon for any purpose other than as specifically contemplated. This paper is based on information provided by or on behalf third parties, from public sources or otherwise reviewed by Consello. Consello assumes no responsibility for independent investigation or verification of such information and has relied on such information being complete and accurate in all material respects. To the extent such information includes estimates and forecasts of future financial performance or events, Consello has assumed that such estimates and forecasts are reasonable. No representation or warranty, express or implied, is made as to the accuracy or completeness of such information and nothing contained herein is, or shall be relied upon as, a representation, whether as to the past, the present or the future. This paper should not be considered a recommendation with respect to any matter. This paper has been developed by and is proprietary to Consello.
This paper was compiled on a confidential basis and not with a view to public disclosure or filing thereof under state or federal securities laws, and may not be reproduced, disseminated, quoted or referred to, in whole or in part, without the prior written consent of Consello.
This paper does not constitute an offer to sell or a solicitation of an offer to purchase any securities and is not a commitment by Consello (or any affiliate) to provide or arrange any financing for any transaction or to purchase any security in connection therewith. This paper may not reflect information known to other professionals in other business areas of Consello and its affiliates.
Consello and its affiliates do not provide legal, accounting or tax advice. Accordingly, any statements contained herein as to tax matters were neither written nor intended by Consello or its affiliates to be used and cannot be used by any taxpayer for the purpose of avoiding tax penalties that may be imposed on such taxpayer. Each person should seek legal, accounting and tax advice based on his, her or its particular circumstances from independent advisors regarding the impact of the transactions or matters described herein.
Broker-dealer services are provided through Consello Financial LLC (Member FINRA and SIPC).
Opinion and Belief; Forward-Looking Statements
Past performance is not necessarily indicative of future results. Certain statements contained in this paper may be based on current expectations, estimates, projections, opinions and beliefs of Consello. All views expressed and any statements relating to expectations regarding future events represent Consello’s own assessment and interpretation of information available to it as at the date of this paper. Such statements involve known and unknown risks, uncertainties and other factors, and undue reliance should not be placed thereon. Such statements represent solely the opinion or belief of Consello and are not expressed herein as the opinion or belief of any other entity or of members of the Consello team or other persons. No representation is made or assurance given that such statements or views are correct. Opinions expressed and other information or statements herein are subject to change without notice. Any discussion of general market activity, industry or sector trends, or other broad-based economic, market, political or regulatory conditions should not be construed as research or advice.
Additionally, this paper contains “forward-looking statements,” which can be identified by the use of terms such as “may”, “will”, “should”, “expect”, “anticipate”, “project”, “estimate”, “intend”, “see”, “continue,” “target,” “plan” or “believe” (or the negatives thereof) or other variations thereon or comparable terminology or forward-looking context. Furthermore, any projections or other estimates in this paper are “forward-looking statements” and are based upon certain assumptions that may change. Due to various risks and uncertainties, actual events may differ materially from those reflected or contemplated in such forward-looking statements. Moreover, actual events are difficult to project and often depend upon factors that are beyond the control of Consello and its affiliates. Recipients of this paper should not rely on such forward-looking statements, and no representation or warranty is made as to future events or results or such forward-looking statements. Nothing in this paper constitutes a guarantee, projection or prediction of future events or results.
Unless otherwise noted, information in this paper is presented as of the date hereof and does not reflect any facts, events or circumstances that may have arisen after that date, is subject to discussion, completion and amendment and does not contain all information necessary to fully evaluate any transaction. Neither Consello nor any other person has any obligation to update this paper (including forward-looking statements herein) or correct inaccuracies or omissions in it.
Copyright © 2025 Consello MB LLC. All rights reserved.