Q1 Earnings Results Underscore Market Concentration and Tariff Risk
Key Q1 Insights
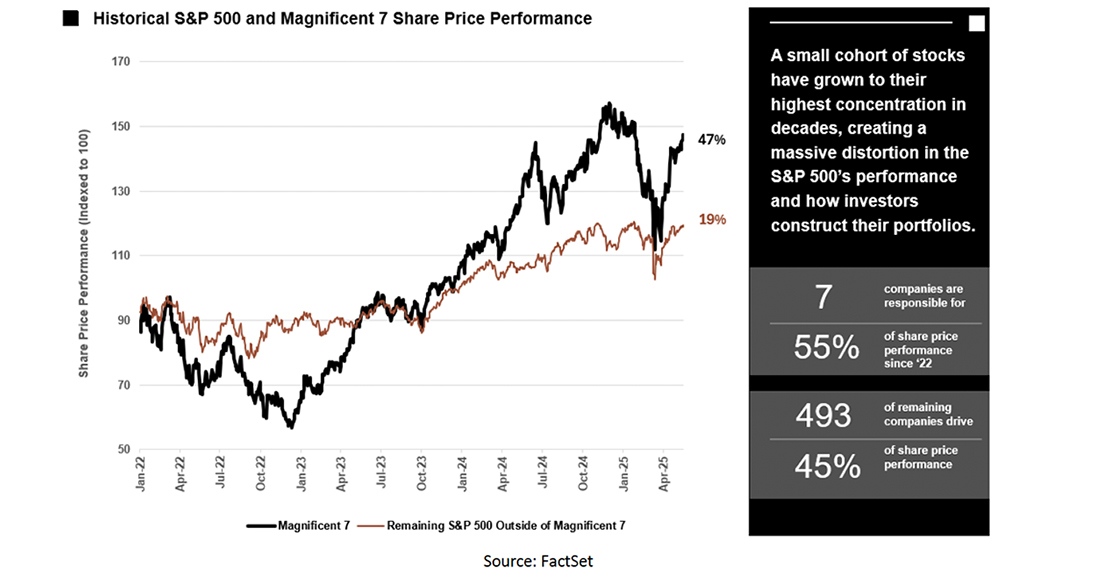
- Q1 earnings season revealed a sharp divide in operating performance between the “Magnificent 7” mega-cap companies and the rest of the S&P 500.1 While headline results point to continued growth, the underlying trends paint a more sobering picture:
- Headline EPS growth for the S&P 5002 came in at +7.2% YoY, marking the seventh consecutive quarter of earnings expansion. However, this strength was highly concentrated. Excluding the “Magnificent 7,” EPS declined -5.2% and revenues fell -1.8%, highlighting the broader softness across the index. Notably, sector-level weakness in Energy and Real Estate significantly offset gains in high growth segments like Tech and Communication Services, reinforcing the view that headline strength is masking underlying earnings pressure in key parts of the market.
- Positive EPS surprises remained high (77% of S&P 500 companies beat), but the magnitude of upside surprises was modest by historical standards.3
- Positive revenue surprises (59% of S&P 500 companies beat) fell well below the five-year average of 69%, reinforcing the narrative of slowing top-line momentum, with tariff and macroeconomic uncertainty potentially weighing on broader results.
- Early Signs That Q1 Was the Bottom
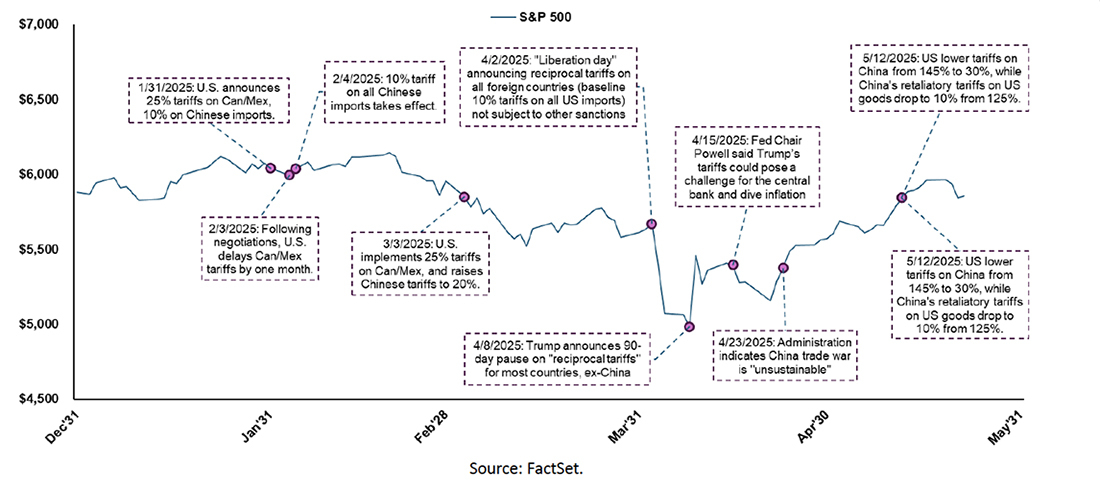
- Markets were volatile in Q1, with the S&P 500 falling nearly 15% from January 1st through early April amid tariff uncertainty, Fed policy ambiguity, and renewed concerns over a growth slowdown. The turning point came on April 8th – following “Liberation Day” – when a 90-day tariff pause was announced. Since then, stocks have rebounded ~20%, setting a more optimistic tone heading into Q2. However, this sharp rally raises the bar for companies to deliver on expectations and manage guidance effectively as we enter Q2 earnings season.
- Forward guidance points to sequential improvement, with the S&P 500 expected to grow Q2 EPS by +1.5% QoQ, led by Industrials and Consumer Staples, each guiding to ~4% QoQ growth in the quarter.
- Only the Real Estate sector is projecting a QoQ decline, reinforcing the view that Q1 may represent the low point for the broader market.
- EPS guidance for Q2 remains skewed to the upside: Among companies that issued EPS guidance for the following quarter, 65 provided a forecast that exceeded analyst consensus, while only 17 issued guidance below market expectations. On the revenue side, 58 companies provided a forecast above analyst consensus, while 13 provided guides below consensus.
- Tariff Volatility Impacted Q1 Guidance Considerations
- In Q1, tariff uncertainty influenced how companies approached forward guidance. While ~10% of companies made structural changes to their guidance strategy – such as withdrawing or widening forecasts – the vast majority acknowledged the tariff overhang. Approximately 75% of companies embedded tariff impacts into their outlooks, and a smaller subset went a step further by explicitly quantifying the financial effects (~9% for the quarter, ~17% for the full year). These adjustments were especially prevalent among companies with high consumer end-market exposure.
Summary of Q1 2025 Results – “Magnificent 7” Strength Masks Broader Weakness Across S&P 500
Q1 marked the seventh consecutive quarter of EPS expansion for the S&P 500, with headline earnings rising +7.2% and revenues up +1.2% year-over-year. However, these figures mask a more bifurcated picture. Stripping out the “Magnificent 7” megacap names – which now make up 34% of the index by market cap – reveals that the broader S&P 500 experienced a -5.2% drop in earnings and a -4.6% decline in revenue. This stark divergence underscores how much of the market’s performance has been driven by just a handful of names.
The sector breakdown further highlights this dispersion – only 3 of 11 sectors posted positive EPS growth when the “Magnificent 7” were excluded. Communication Services (+30.2%), Utilities (+15.6%), and Health Care (+7.8%) led EPS growth, while Energy (-13.4%), Consumer Staples (-10.8%), and Consumer Discretionary (-10.4%) were notable laggards. This uneven performance reinforces that while the index showed resilience on the surface, underlying earnings pressure remains widespread.
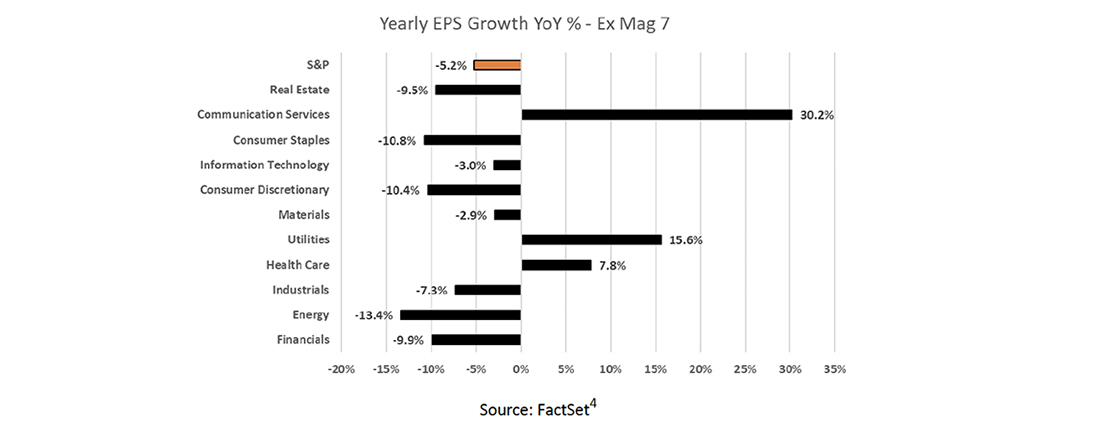
This sector-level dispersion reflects more than just a “Magnificent 7” skew. It signals that earnings pressure is broad-based, particularly across cyclical and defensively oriented sectors. As a result, while headline numbers may imply earnings resilience, the underlying breadth of growth has materially eroded, reinforcing investor caution heading into Q2.
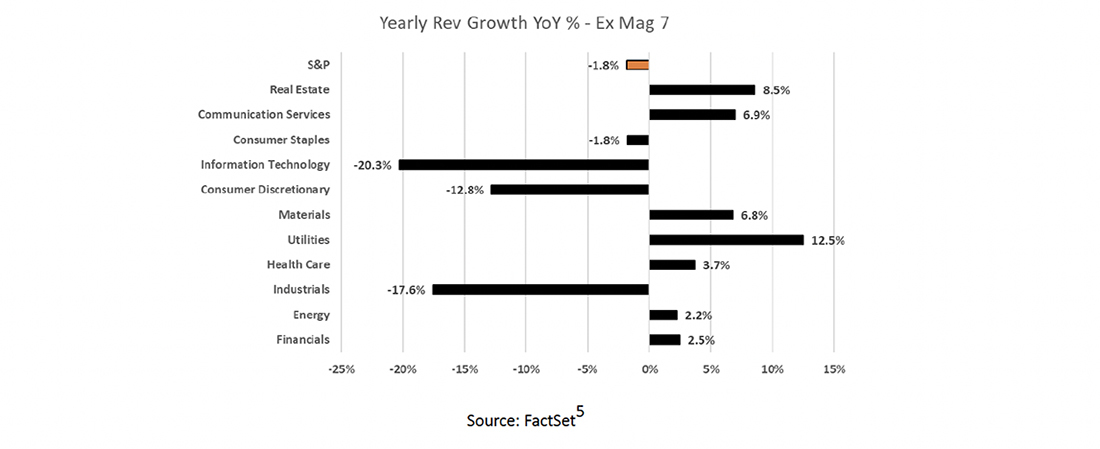
Revenue Growth Skews Negative Without the Megacaps
Only 59% of companies beat revenue expectations, well below the five-year average of 69%, and the average revenue surprise came in at +1.2%, versus a five-year norm of +2.1%. This marks yet another quarter of subdued top-line outperformance, with many sectors struggling to maintain revenue momentum amid tariff-related uncertainty, FX headwinds, and consumer softness.
At the sector level, dispersion was wide. Major sectors reported sharp YoY declines in revenue outside of the “Magnificent 7”:
- Information Technology (-20.3%), Industrials (-17.6%), and Consumer Discretionary (-12.8%) were the weakest performers.
- On the other end, Utilities (+12.5%), Real Estate (+8.5%), and Communication Services (+6.9%) led the way, benefiting from more stable demand and favorable pricing dynamics.
Overall, while the S&P 500 technically extended its streak to 18 consecutive quarters of YoY revenue growth, the underlying breadth of that growth continues to narrow. The data reinforce the idea that headline resilience is masking broad-based weakness, especially across cyclical sectors.
Tariffs & Corporate Guidance Deep Dive – Strategic Adjustments in a Fluid Policy Environment
Tariff volatility defined the Q1 macro backdrop, driving a nearly 15% drawdown in the S&P 500 through early April. As shown in the accompanying chart, sentiment only began to stabilize after the April 8th “Liberation Day” pause. Since then, equities have rebounded nearly 20%, but the policy whiplash left a clear mark on how companies communicated forward-looking guidance.
In response to this uncertainty, Consello reviewed 161 companies – predominantly within the S&P 500 – to assess how corporate guidance practices evolved in Q1. The analysis focused on three primary trends: the extent to which companies modified their typical guidance conventions (e.g., withdrawing or widening forecasts), whether and how tariff impacts were embedded into outlooks, and how sector exposure – especially to consumer-facing markets – shaped these decisions.
This volatility prompted a noticeable shift in how management teams approached guidance. Many reassessed their frameworks, whether by adjusting guidance conventions (e.g., withdrawing, widening, or offering downside scenarios), embedding tariff assumptions, or quantifying impacts where possible. The inconsistent pace and direction of tariff announcements made visibility difficult, resulting in divergent strategies across sectors and increased scrutiny from investors.
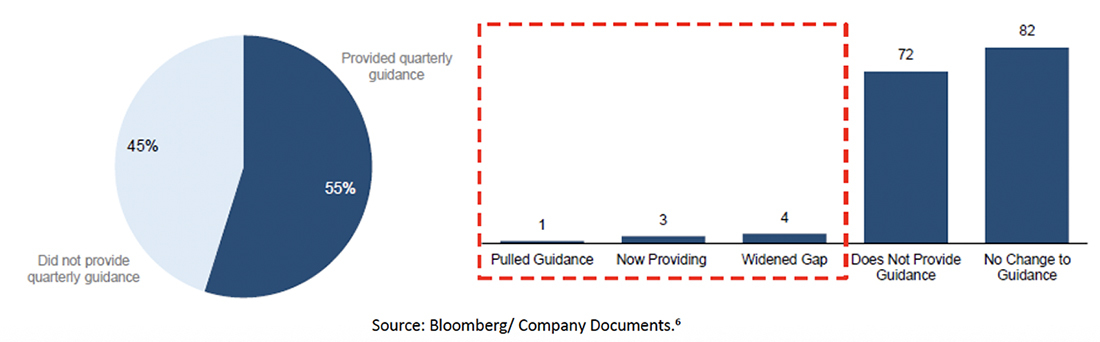
Quarterly Guidance: Due to heightened levels of macroeconomic uncertainty, ~9% of companies (that guide) have modified their quarterly guidance convention, of which there’s been greater focus on widening financial forecast range versus withdrawing guidance. Additionally, ~83% of companies (that guide) have elected to embed the impact of tariffs in quarterly guidance; however, only ~9% of that sample have expressly quantified the tariff impact in guidance.
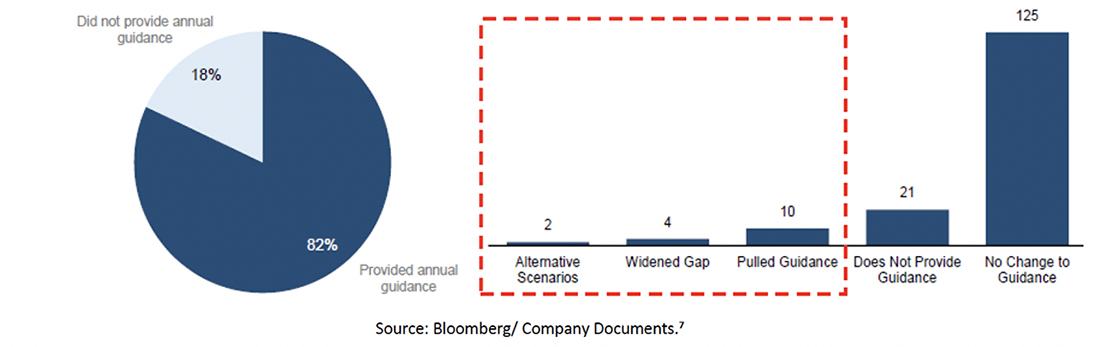
Annual Guidance Overview: A similar story was observed with annual guidance as ~11% of companies (that guide) have modified their guidance convention, of which there’s been greater focus to withdraw guidance versus providing an alternative recessionary scenario and widening their forecast range. Additionally, ~70% of companies (that guide) have elected to embed the impact of tariffs in annual guidance; however, ~17% of that sample have expressly quantified the tariff impact in guidance.
The Role of End-Market Exposure: Among the companies that have engaged in a guidance convention change, a large driver of this decision has been the company’s end-market exposure. Specifically, airlines, autos, and consumer staples were more likely to modify their guidance convention, citing uncertainty around demand, consumer spending, and a volatile pricing environment. As observed, throughout Q1 ~94% of our sample that modified their guidance convention had high consumer exposure, with a greater preference to withdraw guidance (~63%) rather than widen their financial forecast range or provide and alternative recessionary guidance scenario (~38%).
Additionally, sell-side analysts increasingly used earnings Q&A sessions to probe mitigation strategies, the potential for demand pull-forward, shifts in consumer behavior, and supply chain adjustments tied to USMCA compliance. These discussions reflect the broader reality that tariff-driven uncertainty is not just affecting operations, it’s actively reshaping how companies communicate with investors.
Full-year Growth Revised Lower
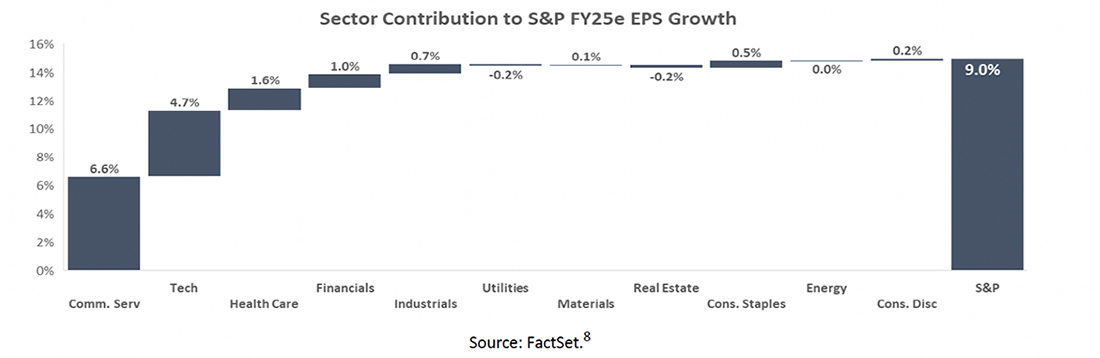
Overall, consensus FY 2025 S&P 500 EPS growth is now projected at 9.0%, down from 11.6% at the end of Q4. The downward revision reflects Q1’s softer performance outside the “Magnificent 7,” where broad-based earnings and revenue declines weighed on full-year expectations.
That said, there are encouraging signs that Q1 may represent the low point. Management teams have issued more constructive Q2 guidance, with 65 companies guiding EPS above consensus (vs. 17 below) and 58 raising revenue outlooks (vs. 13 lowering). The S&P 500 is also expected to post +1.5% EPS growth quarter-over-quarter, led by Industrials and Consumer Staples (each forecasting ~4% growth), while Real Estate remains the only sector anticipating a sequential decline.
Taken together, while full-year estimates have been reset lower, Q2 setup suggests growing confidence that the bottom may already be behind us.
1The “Magnificent 7” includes Alphabet, Amazon, Apple, Meta, Microsoft, Nvidia and Tesla.
2Based on 92% of S&P 500 companies reporting actual results as of May 22.
3Q1 EPS surprised an average of +7.7% vs. the five-year average of +8.8%. Revenue surprised an average of +1.2% vs. the five-year average of +2.1%.
4Weighted average EPS and revenue growth excluding the “Magnificent 7.” This means we reweighted each name within each sector, taking out the 7 companies (which constitute ~34% of the S&P by market cap weighting).
5Some companies have outsized impacts on these weighted growth metrics. For example, Nvidia makes up ~6.1% of the S&P by market cap and saw EPS growth of 72%. As a result, the company contributed ~27% of the S&P’s 18.7% YoY EPS growth.
6~45% of the corporate sample didn’t historically provide quarterly guidance. Charts are representative of all 161 companies analyzed.
7~11% of the corporate sample didn’t historically provide annual guidance. Charts are representative of all 161 companies analyzed.
8Numbers on the chart reference the expected Street (using Factset Consensus) growth rates for each subsector ETF (using SPDR ETFs) multiplied by the sector weight within the S&P 500. For example, the Communication Services sector is 13.0% of the S&P 500 by market weight, and Street estimates for 2025 Earnings Growth are 57.0%, meaning the sector’s contribution to the S&P as a whole is 6.6%.
Disclosures
This paper has been prepared by Consello MB LLC (“Consello”) for the party to whom it has been addressed and delivered and may not be used or relied upon for any purpose other than as specifically contemplated. This paper is based on information provided by or on behalf third parties, from public sources or otherwise reviewed by Consello. Consello assumes no responsibility for independent investigation or verification of such information and has relied on such information being complete and accurate in all material respects. To the extent such information includes estimates and forecasts of future financial performance or events, Consello has assumed that such estimates and forecasts are reasonable. No representation or warranty, express or implied, is made as to the accuracy or completeness of such information and nothing contained herein is, or shall be relied upon as, a representation, whether as to the past, the present or the future. This paper should not be considered a recommendation with respect to any matter. This paper has been developed by and is proprietary to Consello.
This paper was compiled on a confidential basis and not with a view to public disclosure or filing thereof under state or federal securities laws, and may not be reproduced, disseminated, quoted or referred to, in whole or in part, without the prior written consent of Consello.
This paper does not constitute an offer to sell or a solicitation of an offer to purchase any securities and is not a commitment by Consello (or any affiliate) to provide or arrange any financing for any transaction or to purchase any security in connection therewith. This paper may not reflect information known to other professionals in other business areas of Consello and its affiliates.
Consello and its affiliates do not provide legal, accounting or tax advice. Accordingly, any statements contained herein as to tax matters were neither written nor intended by Consello or its affiliates to be used and cannot be used by any taxpayer for the purpose of avoiding tax penalties that may be imposed on such taxpayer. Each person should seek legal, accounting and tax advice based on his, her or its particular circumstances from independent advisors regarding the impact of the transactions or matters described herein.
Broker-dealer services are provided through Consello Financial LLC (Member FINRA and SIPC).
Opinion and Belief; Forward-Looking Statements
Past performance is not necessarily indicative of future results.. Certain statements contained in this paper may be based on current expectations, estimates, projections, opinions and beliefs of Consello. All views expressed and any statements relating to expectations regarding future events represent Consello’s own assessment and interpretation of information available to it as at the date of this paper. Such statements involve known and unknown risks, uncertainties and other factors, and undue reliance should not be placed thereon. Such statements represent solely the opinion or belief of Consello and are not expressed herein as the opinion or belief of any other entity or of members of the Consello team or other persons. No representation is made or assurance given that such statements or views are correct. Opinions expressed and other information or statements herein are subject to change without notice. Any discussion of general market activity, industry or sector trends, or other broad-based economic, market, political or regulatory conditions should not be construed as research or advice.
Additionally, this paper contains “forward-looking statements,” which can be identified by the use of terms such as “may”, “will”, “should”, “expect”, “anticipate”, “project”, “estimate”, “intend”, “see”, “continue,” “target,” “plan” or “believe” (or the negatives thereof) or other variations thereon or comparable terminology or forward-looking context. Furthermore, any projections or other estimates in this paper are “forward-looking statements” and are based upon certain assumptions that may change. Due to various risks and uncertainties, actual events may differ materially from those reflected or contemplated in such forward-looking statements. Moreover, actual events are difficult to project and often depend upon factors that are beyond the control of Consello and its affiliates. Recipients of this paper should not rely on such forward-looking statements, and no representation or warranty is made as to future events or results or such forward-looking statements. Nothing in this paper constitutes a guarantee, projection or prediction of future events or results.
Unless otherwise noted, information in this paper is presented as of the date hereof and does not reflect any facts, events or circumstances that may have arisen after that date, is subject to discussion, completion and amendment and does not contain all information necessary to fully evaluate any transaction. Neither Consello nor any other person has any obligation to update this paper (including forward-looking statements herein) or correct inaccuracies or omissions in it.
Copyright © 2025 Consello MB LLC. All rights reserved.