
Executive Summary:
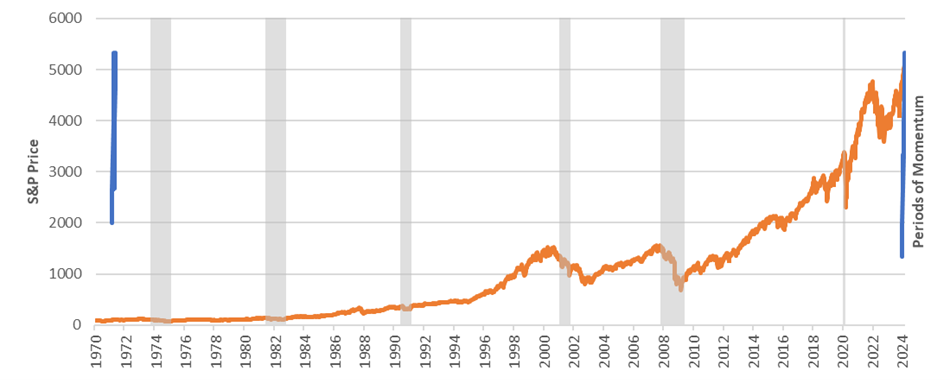
The S&P 500 is currently at all time-highs and has closed higher in 16 of the last 18 weeks, marking a remarkable ~22% increase since this momentum period commenced in November 2023. This marks the longest streak of positive closes since 19711. As result of these and other unique circumstances discussed in this paper, we explore the theme of momentum both from an earnings and market perspective in this Q4’23 Earnings Review.
 Source: FactSet 2
Exiting the Q4 earnings season, we see potential divergence growing between positive market sentiment, with robust stock market growth largely driven by concentrated names over the past four months, and individual company performance. Decelerated earnings growth, lower upside surprises, and mixed near-term operating trends for many are in stark contrast to the small and concentrated group of outperformers. While driving market momentum to new highs, this dynamic may potentially create higher overall delivery expectations for companies outside this select group, at a time when their performance indicators are not as positive.
- Q4 Overview: In Q4’23, the overall S&P 500 index demonstrated another quarter of positive earnings surprises and continued growth. While S&P 500 companies experienced slightly below-average earnings surprises, they continued to witness growth in quarterly revenue and earnings. Specifically, 75% of S&P constituents reported a positive EPS surprise, below the five-year average of 77% but surpassing the ten-year average of 74%. Additionally, 67% of S&P 500 companies reported a positive revenue surprise. Year-over-year, in the fourth quarter, overall growth decelerated relative to Q3’23. Fourth quarter EPS increased by 9.7%, accompanied by a 1.8% rise in sales, marking the 13th consecutive quarter of revenue growth for the index.
- 322 companies reported positive EPS surprises, with a +13.5% weighted3 earnings surprise and +2.9% revenue surprise (YoY). Five sectors reported YoY earnings growth, led by Communications (+85.9%) and Tech (+23.5%).
- Most sectors have exceeded earnings expectations, with 10 out of 11 sectors surpassing consensus estimates. Notably, the Materials (12.2%), Industrials (11.2%), and Energy (9.6%) sectors delivered the most significant earnings beats. However, revenue surprises remained modest at +0.7% for the S&P 500, with Utilities (-7.5%) experiencing the largest negative surprise.
- Despite, on average, posting earnings upside surprises, on Q4’23 earnings calls, companies in various sectors cited ongoing headwinds to 2024 profit margins, stemming from rising elasticity, elevated promotional levels as well as higher labor and select input costs.
- Share prices: Stocks saw a +1.0% weighted five-day stock price increase post-earnings. Heading into earnings, prices increased +1.8% over the prior month.
- Guidance: The total number of companies providing any quarterly guidance (currently 22% of the S&P) is below prior quarters (28-30%). Additionally, ~ 60% of companies (302 companies) have provided guidance for FY2024. Among these, 230 companies have issued EPS guidance indicating growth over FY2023 EPS, and 182 have provided higher year-over-year revenue guides.
- S&P’s strong performance fueled by concentration amongst the “Magnificent 7”4 and retail investors.
- 42% of the S&P’s 20%+ performance over the last three months is due the top 10 largest names within the S&P, of which 70% is attributed to three major tech stocks (Nvidia, Microsoft, and Amazon).
- This performance exceeds the average contribution of the top 10 names during previous momentum periods.5 On average, the top 10 names (by market cap) contributed6 29% on the upside and 36% on the downside.
- Retail participation in overall trading volume has surpassed 2021 highs, with approximately 25% of total equities trading volume attributed to retail investors. This figure has continued to increase throughout 2023 (in dollar terms).7
- Retail stock ownership has reached a decade high, with around two-thirds of retail investors holding US equities, a level comparable to pre-financial crisis.8
- The market is at all-time highs, with S&P 500 index price targets continuing to rise.
- The S&P index is up 22% since the start of this recent momentum-backed rise in November, and Street analysts are raising price targets for the index.
- S&P constituent target prices have risen since the start of this most recent momentum period: Over the last 18 weeks, the weighted average week-over-week price target rise for the constituents of the S&P 500 were 75% (meaning 13 of the 18 weeks, on average, saw week-over-week rising target prices).
- S&P Price target continues to rise over the last three months: S&P end-of-year price target is currently $4897 (median $5000) vs. Dec’s $4833 estimate (median $4850).
- Other indicators show current momentum factors are not abnormal.
- RSI levels are high, but not considered overbought: Current S&P 500 RSI at 53 (>70 is overbought). Bullish investors appear to be gravitating toward specific themes like AI, obesity success in healthcare, and deflation / rate cuts.
- Trading volumes are high, but not at all-time highs: During the current momentum period (Nov’23 to Feb’24), weekly trading volumes for the S&P averaged approximately 3.2 billion shares, slightly surpassing the five-year average of ~3.1 billion shares. However, this is significantly lower than the volumes observed during sell-off periods following the Dot-Com Bubble and the Financial Crisis, where weekly shares traded reached 9.5 billion shares per week, nearly three times higher than current levels.
Specific Q4 Earnings Highlights
S&P 500 Companies See Below-Average Earnings Surprises and 13th Consecutive Quarterly Revenue Growth:
- 75% of S&P 500 companies have reported a positive EPS surprise, which is below the five-year average of 77%, but above the ten-year average of 74%. 67% of S&P 500 companies have reported a positive revenue surprise.
- The positive revenue growth marks the 13th consecutive quarter of revenue growth for the index. This would mark the second-longest period of consecutive quarters of revenue growth for the S&P since 2008.9
- YoY earnings and revenue growth for the S&P in Q4’2023 are 9.7% and 1.8%, respectively, which are both below the 11.4% and 5.1% earnings and revenue growth seen in Q3, implying a deceleration in growth.
Most Sectors Seeing Positive Earnings Surprises, Revenue Surprises More Muted:
- 10 of 11 sectors10 experienced positive earnings surprises vs. consensus, led by the Materials (12.2%), Industrials (11.2%), and Energy (9.6%) sectors, which had the largest average positive surprises vs. consensus.
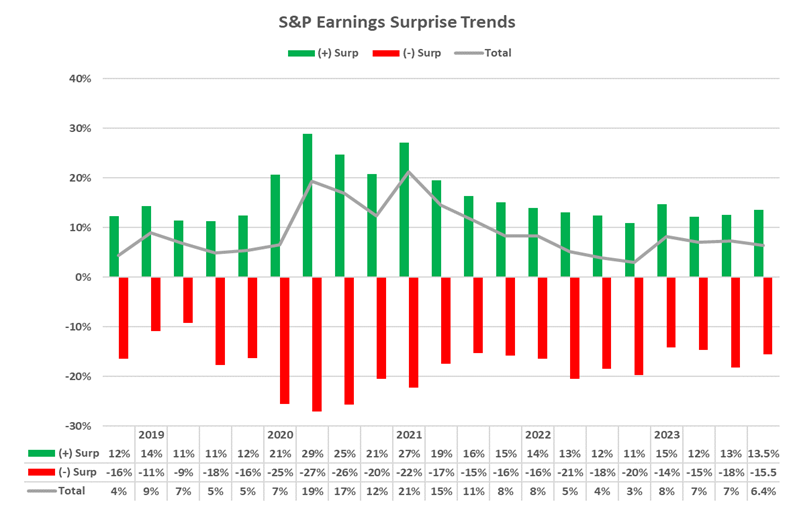
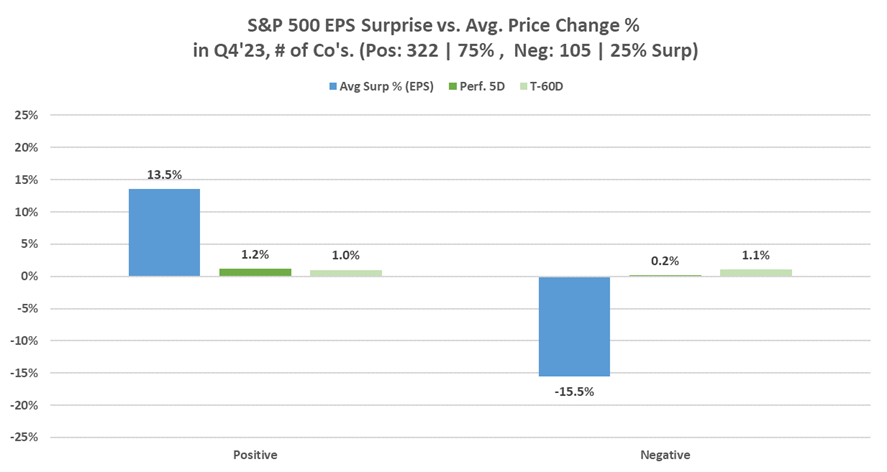
- In aggregate, companies are reporting earnings that are 6.4% above estimates (weighted average positive surprises for S&P 500 companies was 13.5% in the quarter and was -15.5% for negative surprises in the quarter), which is below both the five-year and ten-year averages of 8.5% and 6.7%, respectively.
- Revenue surprises have been far more muted than EPS; the weighted average S&P 500 revenue surprise was 0.7% in Q4. The Energy (2.7%) and Health Care (2.2%) sectors exhibited the most substantial weighted EPS surprise on average, with Utilities (-7.5%) seeing the largest negative average surprise.
Stock Reactions:
- Of the S&P companies that have reported thus far, the weighted average five-day post-reporting price increase is 1.0%, which is below the S&P 500’s 1.1% five-day move and above the sector-specific indices’ 0.9% increase.11
- Heading into earnings:
- Given the strong momentum seen throughout the market since November, reporting companies’ shares increased a weighted average 1.8% per month prior to earnings (+5.8% for companies that reported positive earnings and -4.2% for those that reported negative results).
- Looking further at a two-month horizon, S&P constituents were up 5.9% on average (+10.3% for positive surprises and -5.5% for negative earnings).
- The one-month and two-month price growth is trailing behind the 3.6% and 6.5% growth observed for the S&P 500 and the 2.2% and 5.2% growth of all 11-subsector ETFs during the same periods.
Q4 Earnings Season Overview:
- 322 companies reported positive earnings surprises, with a 13.5% and 2.9% weighted average EPS and revenue surprise, respectively. 75% of companies reported higher actual earnings than Street estimates.
- Positive Earnings Growth Predominantly Observed in Sectors with Exposure to Artificial Intelligence
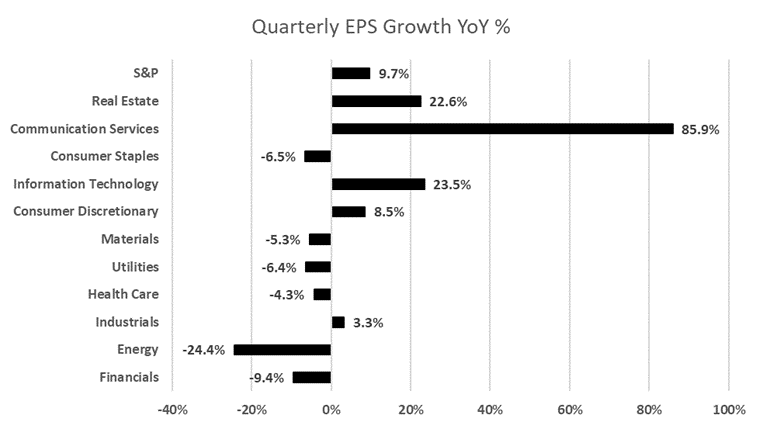
- 5 of 11 sectors reported YoY earnings growth, with the Communications Services sector (+85.9%) and Tech sector (+23.5%) leading.
- The Communication sector’s positive earnings growth was led by strong performance from the mega-cap Magnificent 7, and within Tech, Nvidia, up 239% in 2023, contributed nearly 3/4ths of positive earnings growth within the sector.
- Revenue Growth Varied Among Sectors:
- Sector revenue growth was once again more muted than earnings growth, with YoY revenues increasing 1.8%.
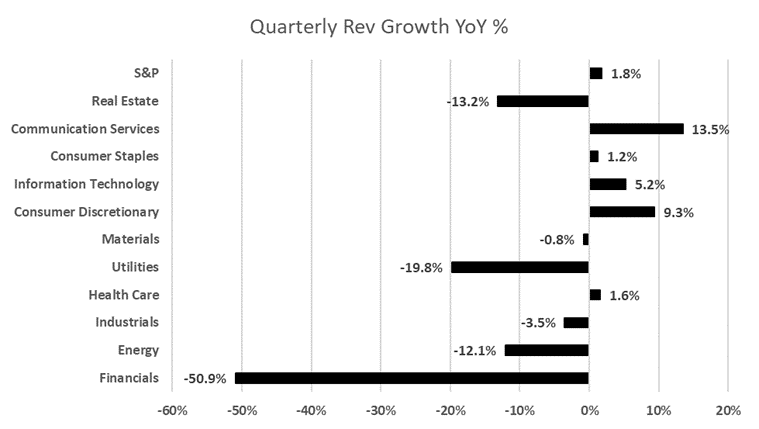
- 5 out of 11 sectors reported positive YoY revenue growth, led by Communication Services (13.5%), Consumer Discretionary (9.3%), and Technology (5.2%). On the contrary, Financials (-50.9%) and Utilities (-19.8%) saw the largest revenue declines YoY.
Q4 Economic Overview
- Unemployment continues to hover between 3.4 – 3.8% since early 2022. In January, the unemployment rate was 3.7% (versus survey’s expectation of 3.8%) for the third month in a row, and the number of unemployed people was little changed at 6.1 million. The labor force participation rate was also unchanged in February and remained at 62.5%.
- Headline nonfarm payrolls increased by 353K in January (vs. an upwardly revised 333K gain in December). More importantly, revisions for the jobs market were revised upward for 2H23.
- Both headline and core CPI accelerated in January, rising 0.3% (vs. 0.2% prior) and 0.4% (vs. 0.3% prior), respectively.12
- The PCE price index, which is the Federal Reserve’s preferred measure of inflation, declined less than the survey’s expectations. In Jan, PCE was 2.9% (vs. the survey’s expected 2.8%), and lower than the 3.2% seen in December.
- January’s FOMC statement and Fed Chair Powell’s press conference both pushed back against the idea of imminent rate reductions, saying the committee will only cut once it has “greater confidence” inflation is moving to the target.
- Initial positioning pointed to a 70% chance of a March interest rate cut, but after comments from Fed speakers, expectations fell; as of late February, the chance of a cut is just 2.7%.
- In January, the PPI for final demand rose 0.9% YoY, as a -1.7% decrease in producer prices for goods and a 1.0% decrease in producer prices for construction were more than offset by a 2.2% increase in producer prices for services. The 1.0% decrease in producer prices for construction was the first yearly decline in the construction index since YoY data began in November 2010.
- The U.S. Commerce Department’s Bureau of Economic Analysis (BEA) reported 4Q GDP increased to 3.3%, exceeding expectations.
- For the full year, retail sales, excluding auto and gas, increased by 4.9%. Inflation-adjusted, or real, disposable personal income rose 4.2% in 2023. Americans also are saving more, with the personal saving rate rising to 4.5% at the end of 2023.
Q4 Insights
- Earnings: For Q4’23, 75% of S&P 500 companies have reported a positive EPS surprise and 67% of S&P 500 companies have reported a positive revenue surprise.
- Earnings trends QoQ: For Q4’23, the blended (QoQ) earnings decline for the S&P 500 is -9.9%. The blended (QoQ) revenue increase for the S&P 500 is 2.5%.
- Earnings trends YoY: For Q4’23, the blended (YoY) earnings increase for the S&P 500 is 9.7%. The blended (YoY) revenue increase for the S&P 500 is 1.8%.
- Guidance: At this point in the earnings season, the number of companies providing guidance has fallen from the previous quarter (Q4 Guidance: 111 companies; Annual 2023 Guidance: 302 companies):13
- For Q1’2024, 28 S&P 500 companies have issued negative EPS guidance and 96 S&P 500 companies have issued positive EPS guidance. 43 S&P 500 companies have issued negative revenue guidance and 64 S&P 500 companies have issued positive revenue guidance.
- The total number of companies providing guidance (currently 22% of the S&P) is below prior quarters (28-30%).
- 302 companies in the index have issued EPS guidance for the upcoming fiscal year (FY 2024), with 230 providing EPS guides higher vs FY 2023, and 182 providing higher YoY revenue guides.
 Source: FactSet 14
 Source: FactSet 15
S&P 500 earnings growth trends below long-term averages despite exceeding estimates
75% of S&P 500 companies reported positive EPS surprises (EPS higher than consensus), below the five-year average of 77% but above the ten-year average of 74%. 67% of S&P 500 companies have reported a positive revenue surprise.
YoY earnings for reporting companies increased by 9.7% on average for Q4 2023, falling below the significant 11.4% growth seen in Q3. The 9.7% earnings growth is higher than the five-year average earnings growth rate of 9.5%.
Over the quarter thus far, companies are reporting earnings that are 6.4% above estimates (weighted average positive surprises for S&P 500 companies was 13.5% in the quarter versus 12.6% in Q3 and was -15.5% for negative surprises in the quarter, compared to -18.2% in Q3), which is below both the five-year and ten-year averages of 8.5% and 6.7%, respectively.
 Source: FactSet 16
The market’s reactions to earnings appear more subdued compared to previous quarters
Despite the strong momentum observed throughout this quarter, the market isn’t penalizing negative results as severely as it has over previous quarters. Among the 75% of S&P 500 companies that have reported thus far, there has been an average five-day price increase of 1.0%, slightly below the S&P 500’s 1.1% five-day move yet surpassing the sector-specific indices’ 0.9% increase.17
For positive earnings surprises, the average five-day performance was 1.2%, which is larger than the five-year average move of 0.9%. However, in comparison, the S&P was up +1.4% and sector ETFs were up +1.6% during the same window. Markets rewarded the Utility and Energy sectors the most with +9.6% and +0.9% EPS surprises seeing +0.6% and +0.7% five-day share price increases. Notably, both the magnitude of the earnings surprises and subsequent price performance have been significantly more muted than in previous quarters.
Negative earnings surprises and average five-day performance were also more muted; on average, the reporting companies missed EPS by -15.5% and revenues by -3.6%. Their five-day performance was -4.3%, which is lower than the five-year average quarterly move of -2.3%. Markets punished companies within the Consumer Discretionary and Real Estate sectors that missed on EPS with the largest negative price moves, with the average negative EPS surprise of -33.7% within the Consumer Discretionary sector seeing -2.0% five-day price moves, and -42.4% within the Real Estate sector seeing -1.1% five-day price moves.
 Source: FactSet 18
 Source: FactSet 19
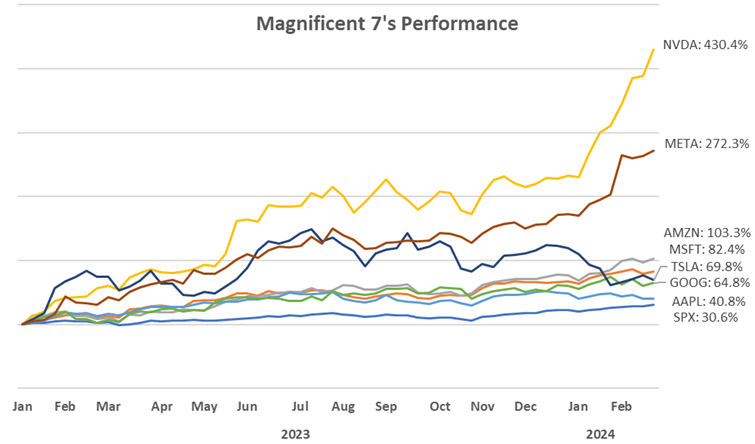
A closer look at the “Magnificent 7” – the AI generation
A select group of stocks, the Magnificent 7, including Apple, Alphabet, Amazon, Meta, Microsoft, Nvidia, and Tesla, has significantly bolstered the performance of the US equity market. Their influence is substantial; without them, the S&P 500 index’s return last year would have been less than 10%. These companies, except Tesla, rank among the world’s top seven by market capitalization and collectively accounted for 30.7% of the S&P 500’s weighting, while contributing an astonishing 89% of the S&P’s year-over-year expected earnings growth throughout 2023.
This Magnificent Seven represents an economic force comparable to entire countries, with a combined market value exceeding that of Japan’s equity market. However, their dominance has slightly diminished, with data showing that in January, these top seven stocks were responsible for 45% of the S&P 500’s gains, a decrease from previous levels.
Nvidia’s EPS grew an astonishing 486% YoY ($0.88 in Q4’22 and $5.16 in Q4’23) and beat consensus expectations by 25.9%. Meta’s EPS grew 203% YoY ($1.76 in Q4’22 and $5.33 in Q4’23) and beat consensus expectations by 10.5%. Tesla’s EPS declined by -40% year-over-year ($1.19 in Q4’22 and $0.71 in Q4’23) and missed consensus expectations by -4.2%.
 Source: FactSet 20
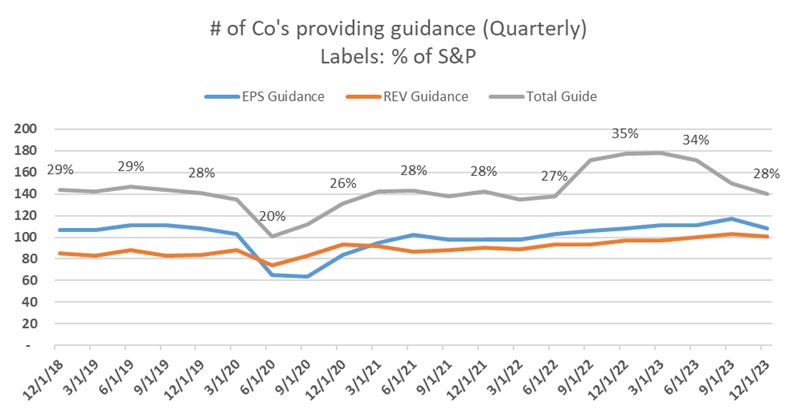
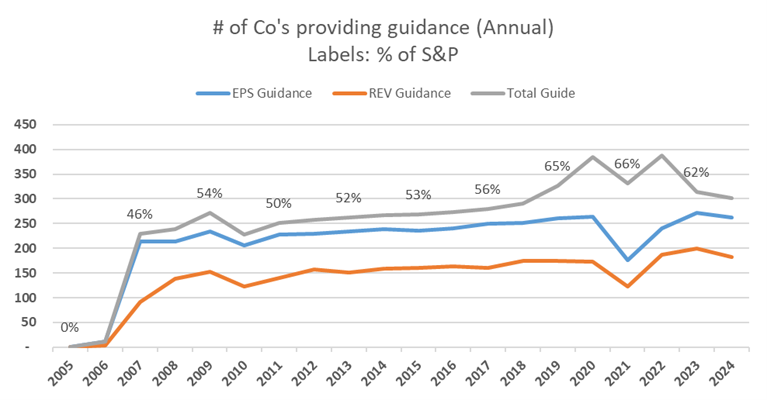
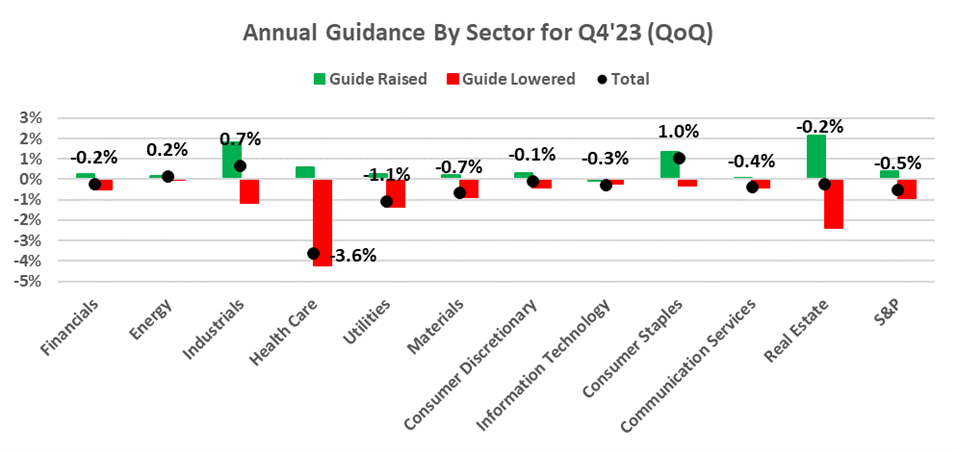
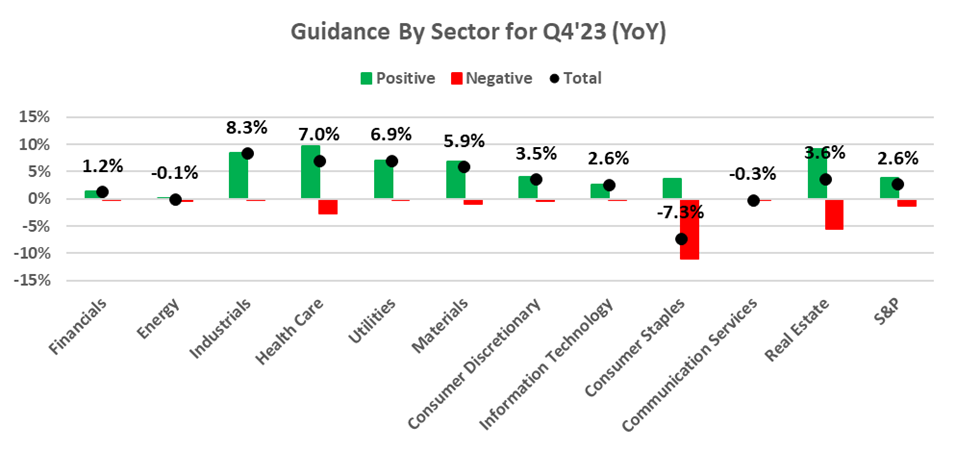
Number of Companies Providing Quarterly Guidance Continues to Decline Post-Covid Peak
The number of S&P 500 companies providing quarterly forecasts continues to tick down slightly to 22% (111 companies) from post-pandemic peaks of 35%. Similarly, albeit early in 2024, the number of companies providing annual guidance marginally decreased as well to 60% of the S&P (302 companies).
Of the sample set, 94 companies in the index have issued EPS guidance for Q1’2024, and 111 companies have given Q1 guidance of any sort; 302 companies in the index have issued EPS guidance for the current fiscal year (FY 2024/ 2025). 230 have issued positive guidance (guidance raised in the quarter for the year or kept unchanged following a raise in the previous period) and 49 have issued negative EPS guidance (guidance lowered in the quarter or kept unchanged following a decrease in the previous quarter).
Among positive annual guidance raises in the quarter, the Industrials sector was the largest beneficiary, seeing average annual guidance raised by 8.3%. Meanwhile the Consumer Staples sector saw the largest pullback in guidance with an average reduction in annual guidance of -7.3%.
 Source: FactSet 21
Additional Q4 Data Points
As we progress through the Q4 earnings season, the S&P 500’s performance compared to earnings estimates shows a mixed picture. While the proportion of S&P 500 companies reporting positive earnings surprises exceeds the ten-year average, the extent of these surprises remains below the ten-year average. However, the index is posting earnings growth for the second consecutive quarter on a year-over-year basis.
The number of companies reporting positive earnings surprises has declined slightly (from 386 in Q3 to 322 in Q4), while the magnitude of these earnings surprises has increased by ~1% to 13.5%. However, due to the smaller quantity of positive earnings, YoY earnings increased by 9.7% on average for Q4 2023, falling below the significant 11.4% growth seen in Q3. The 9.7% earnings growth is still above the five-year average earnings growth rate of 9.5%.
Overall, 75% of the companies in the S&P 500 have reported actual results for Q4’2023 to date. Of these companies, 75% have reported a positive EPS surprise and 67% have reported a positive revenue surprise. The 75% positive earnings surprise rate is below the five-year average of 77% but above the ten-year average of 74%. Utilizing a weighted average aggregate approach, the blended (YoY) earnings increase for the S&P 500 is 9.7%, which is above the five-year and ten-year averages of 8.5% and 6.7%, respectively. The blended (YoY) revenue increase for the S&P 500 is 1.8%.
Positive EPS growth YoY from the Communication Services and Tech sectors, while Energy and Financials fell due to tougher comps and interest rates:
Year over year, 5 of 11 sectors in the S&P have reported EPS growth led by the Communications Services sector (+85.9%), Tech (+23.5%) and Real Estate (+22.6%). The communication sector’s positive earnings growth was led by strong performance from the mega-cap Magnificent 7, with Netflix (48.3%), Meta (21.8%), and Alphabet (25%) contributing 95% of the sector’s earnings growth. Within Tech, Nvidia, up 239% in 2023, contributed nearly three quarters of positive earnings growth within the sector; its EPS grew by 486% from $0.88 in Q4’2022 to $5.16 in Q4’2023.
The largest declines in EPS YoY came from the Energy sector (-24.4%), Financial sector (-9.4%) and Consumer Staples sector (-6.5%). Two companies within the energy sector were highly impaired by falling oil prices in 2023, which saw crude oil prices decline -11% throughout the year, and saw EPS fall between 16 and 27%. Together, they contributed to over 50%+ of the sector’s yearly EPS decline. Similarly, a significant portion of the Banks industry was the largest contributor to the year-over-year decline in earnings for the Financials sector. Actual results for most of the companies in the Banks industry include FDIC special assessments which, paired with lower fixed income rates, had the largest negative impact on earnings for the quarter.
 Source: FactSet 22
Companies beating revenue estimates (67%), led by Communication Services and Tech
Like previous quarters, revenue growth for each sector was more muted than earnings growth, with YoY revenues increasing 1.8% (positive companies saw 2.6% and negative companies saw -2.9% throughout the year).
67% of companies (290 companies) have thus far reported actual revenues above consensus estimates, which is below the three-year average of 71% and below the ten-year average of 64%. 67% of positive revenue surprises would be the third lowest quarterly figure since Q1 2020 (59%).
5 out of 11 sectors reported positive YoY revenue growth, led by Communication Services (13.5%), Consumer Discretionary (9.3%), and Technology (5.2%). On the contrary, Financials (-50.9%) and Utilities (-19.8%) saw the largest revenue declines YoY.
 Source: FactSet 23
1 According to data compiled by Deutsche Bank and our own research.
2 The graph above shows similar significant pockets of momentum (~15 weeks of positive closes), which has only occurred one time since 1970 (between 12/25/1970 and 4/23/1971). In addition, the grey bars show the six recessionary periods since 1970. The blue columns outline the periods of similar momentum to the one seen from Nov’23 to Feb’24.
3 The weighted average return was computed by utilizing each company’s weight within the S&P 500 as of 12/31 and its actual over consensus for “surprise” metrics, while Year-over-Year (YoY) figures were employed for “growth” metrics, also as of 12/31.
4 Consists of Nvidia, Microsoft, Apple, Amazon, Alphabet, Tesla, and Meta. Profits at these seven companies are greater than the profits of all publicly traded companies in nearly every G20 country. And in terms of market value, they’d be the second-largest national stock exchange in the world.
5 Referencing the seven periods highlighted above.
6 Bloomberg. Contribution here is defined by % of S&P’s total return in a specific time period. So in this example, the top 10 largest names by market cap weight within the S&P during seven similarly high momentum periods over the last 35 years were responsible for 29% of the S&Ps performance, on average, during each period.
7 https://www.forbes.com/sites/dereksaul/2023/02/03/retail-trading-just-hit-an-all-time-high-heres-what-stocks-are-the-most-popular/?sh=33c796d96664
8 https://news.gallup.com/poll/266807/percentage-americans-owns-stock.aspx
9 Factset
10 All sectors saw positive earnings surprises except Real Estate, which missed consensus by an average of 1.2%.
11 We are using the Select Sector Spider ETFs to represent each of the S&P’s 11 sectors.
12 January inflation readings tend to be among the highest of the year, with higher volatility stemming from services categories (airfares and hotels).
13 Factset.
14 Total Guide represents the sum of companies that guided at least one of the following metrics: EPS, Revenue, EBITDA, Net Income, CapEx, Free Cash Flow, SS NOI, and Net Interest Income.
15 Ibid.
16 Positive and negative EPS surprises are calculated by taking the weighted average (by market cap) of each S&P constituent. The total calculation is also a weighted average calculation, and thus doesn’t lie in the middle of the negative and positive EPS surprises.
17 Results calculated by taking average price moves for the companies, the S&P 500, and S&P subsector ETFs over the five days following each company’s earnings announcement. The large caveat here is we are assuming 100% of the price moves are as a direct result of the companies’ earnings; in reality, there are idiosyncratic and correlation risks affecting price moves.
18 Weighted average EPS surprise for positive and negative surprises, and respective average share performance two months prior to earnings and five days after earnings.
19 Earnings surprises broken down by positive and negative surprises for all 11 S&P sectors.
20 Comparing Q1’24 with Q1’23.
21 Factset.
21 Factset.
22 Factset.
23 Factset.
Disclosures
This paper has been prepared by Consello MB LLC (“Consello”) for the party to whom it has been addressed and delivered and may not be used or relied upon for any purpose other than as specifically contemplated. This paper is based on information provided by or on behalf third parties, from public sources or otherwise reviewed by Consello. Consello assumes no responsibility for independent investigation or verification of such information and has relied on such information being complete and accurate in all material respects. To the extent such information includes estimates and forecasts of future financial performance or events, Consello has assumed that such estimates and forecasts are reasonable. No representation or warranty, express or implied, is made as to the accuracy or completeness of such information and nothing contained herein is, or shall be relied upon as, a representation, whether as to the past, the present or the future. This paper should not be considered a recommendation with respect to any matter. This paper has been developed by and is proprietary to Consello.
This paper was compiled on a confidential basis and not with a view to public disclosure or filing thereof under state or federal securities laws, and may not be reproduced, disseminated, quoted or referred to, in whole or in part, without the prior written consent of Consello.
This paper does not constitute an offer to sell or a solicitation of an offer to purchase any securities and is not a commitment by Consello (or any affiliate) to provide or arrange any financing for any transaction or to purchase any security in connection therewith. This paper may not reflect information known to other professionals in other business areas of Consello and its affiliates.
Consello and its affiliates do not provide legal, accounting or tax advice. Accordingly, any statements contained herein as to tax matters were neither written nor intended by Consello or its affiliates to be used and cannot be used by any taxpayer for the purpose of avoiding tax penalties that may be imposed on such taxpayer. Each person should seek legal, accounting and tax advice based on his, her or its particular circumstances from independent advisors regarding the impact of the transactions or matters described herein.
Broker-dealer services are provided through Consello Financial LLC (Member FINRA and SIPC).
Opinion and Belief; Forward-Looking Statements
Past performance is not necessarily indicative of future results. Certain statements contained in this paper may be based on current expectations, estimates, projections, opinions and beliefs of Consello. All views expressed and any statements relating to expectations regarding future events represent Consello’s own assessment and interpretation of information available to it as at the date of this paper. Such statements involve known and unknown risks, uncertainties and other factors, and undue reliance should not be placed thereon. Such statements represent solely the opinion or belief of Consello and are not expressed herein as the opinion or belief of any other entity or of members of the Consello team or other persons. No representation is made or assurance given that such statements or views are correct. Opinions expressed and other information or statements herein are subject to change without notice. Any discussion of general market activity, industry or sector trends, or other broad-based economic, market, political or regulatory conditions should not be construed as research or advice.
Additionally, this paper contains “forward-looking statements,” which can be identified by the use of terms such as “may”, “will”, “should”, “expect”, “anticipate”, “project”, “estimate”, “intend”, “see”, “continue,” “target,” “plan” or “believe” (or the negatives thereof) or other variations thereon or comparable terminology or forward-looking context. Furthermore, any projections or other estimates in this paper are “forward-looking statements” and are based upon certain assumptions that may change. Due to various risks and uncertainties, actual events may differ materially from those reflected or contemplated in such forward-looking statements. Moreover, actual events are difficult to project and often depend upon factors that are beyond the control of Consello and its affiliates. Recipients of this paper should not rely on such forward-looking statements, and no representation or warranty is made as to future events or results or such forward-looking statements. Nothing in this paper constitutes a guarantee, projection or prediction of future events or results.
Unless otherwise noted, information in this paper is presented as of the date hereof and does not reflect any facts, events or circumstances that may have arisen after that date, is subject to discussion, completion and amendment and does not contain all information necessary to fully evaluate any transaction. Neither Consello nor any other person has any obligation to update this paper (including forward-looking statements herein) or correct inaccuracies or omissions in it.
Copyright © 2024 Consello MB LLC. All rights reserved.