Summary:
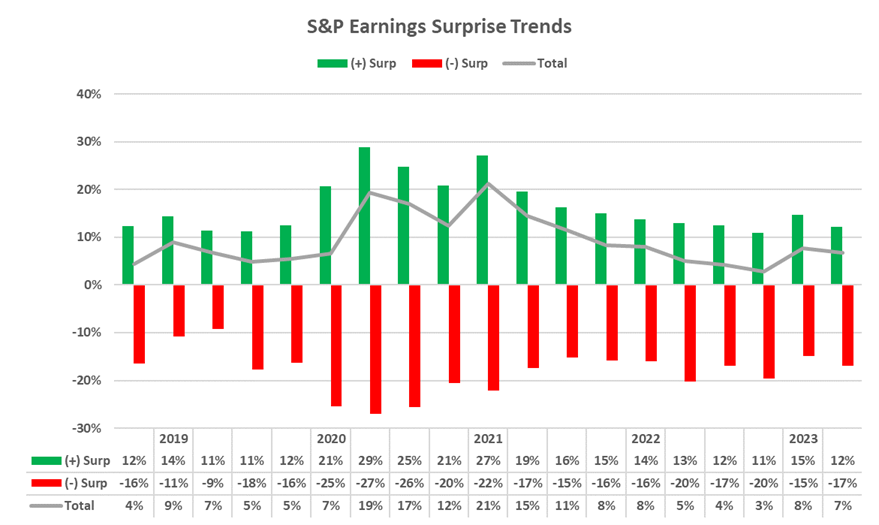
In 2023, despite a high percentage of S&P 500 companies exceeding earnings expectations, the second quarter highlighted a concerning trend of negative stock market reactions to positive earnings surprises, the likes of which haven’t been seen since 2011. This dynamic suggests investors may have become more stock-specific selective, even with market volatility near a four-year low.
On top of evolving reactions, the YoY decline in earnings ended a streak of earnings growth rates, raising profit outlook questions post-pandemic for a number of companies. While sectors like Consumer Discretionary showed robust expansion, others (Energy, Real Estate, etc.) displayed ongoing challenges.
Positively, the resurgence of sharing quarterly guidance indicates management teams’ business confidence. However, the prevalence of negative stock responses to subsequent earnings surprises indicates that there are diminishing returns for companies that cannot dramatically exceed their shared guidance.
This research paper’s findings illustrate the shifting market dynamics (20-year-high inflationary headwinds, war and sanctions affecting energy prices, and the uncertainty of consumers’ responses) entering the second half of 2023. The higher prevalence of negative stock reactions to positive earnings surprises implies a higher bar for companies to impress investors. This suggests management teams should closely monitor how the market receives earnings, even when exceeding estimates, and amend communication as necessary. As certain sectors face growth challenges, discerning optimal timing and messaging around forecasts has become more vital to demonstrating positive performance and enhancing shareholder value. With the reactions toward positive surprises waning, delivering standout results and consistency could differentiate which companies are able to navigate through uncertainty.
In conclusion, though each business faces unique circumstances, the data indicates investors are increasingly selective in rewarding earnings outperformance. It is also important to realize that in certain sectors, a significant portion of earnings outperformance and guidance stemmed from a few outlying companies (Exxon Mobil, Amazon and Nvidia, to name a few). Therefore, evaluating peer groups is important as it allows management to judge EPS and revenue performance in a smarter way without those outliers affecting averages.
Q2 Earnings Highlights:
S&P 500 Companies See Largest Negative Price Reaction to Positive EPS Surprises Since 2011:
- 81% of S&P 500 companies reported EPS higher than consensus, slightly above the three-year average.
- Earnings have exceeded consensus by 6.7% in the quarter, below the three-year average.
- YoY earnings decline for Q2 2023 is 8.6%, breaking a trend of three consecutive quarterly earnings increases.
- Reporting companies’ share prices rose an average of 3.7% one month prior to earnings (6.2% for companies that reported positive earnings and -3.9% for those that reported negative results). Looking further at a two-month horizon, S&P constituents were up 8.7% on average (11.4% for positive surprises and -5.2% for negative earnings). The one-month and two-month price growth outweighs the 2.9% and 7.3% growth seen by the S&P and 3.1% and 7.4% growth seen by corresponding sector ETFs over the same periods.
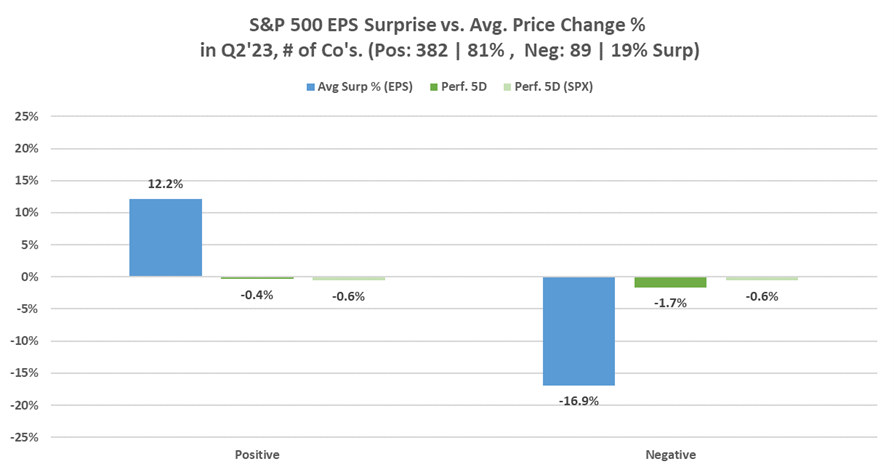
Markets Reacting Negatively to Positive Average EPS/Revenue Surprises:
- Companies experienced an average five-day post-reporting price decrease of -0.7%, lower than the five-year average of 1.0%.
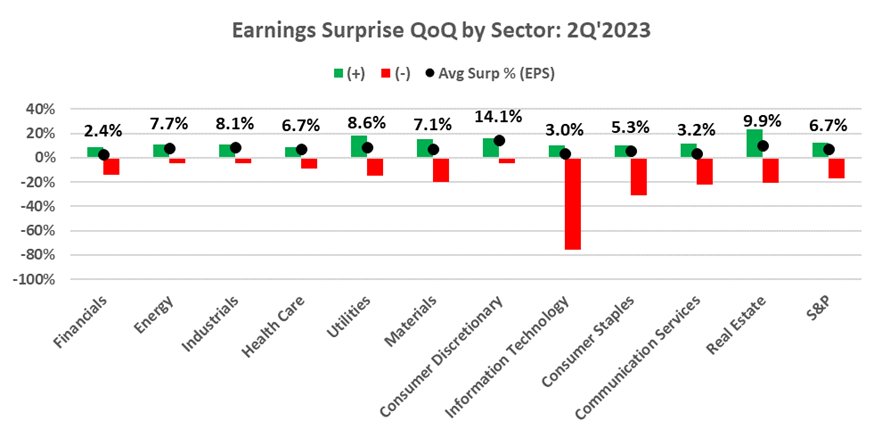
- Consumer Discretionary, Real Estate, and Utilities sectors had the largest average positive surprises vs. consensus.
- Among the companies that experienced negative surprises, Tech sector names exhibited the most substantial weighted negative EPS surprise on average.
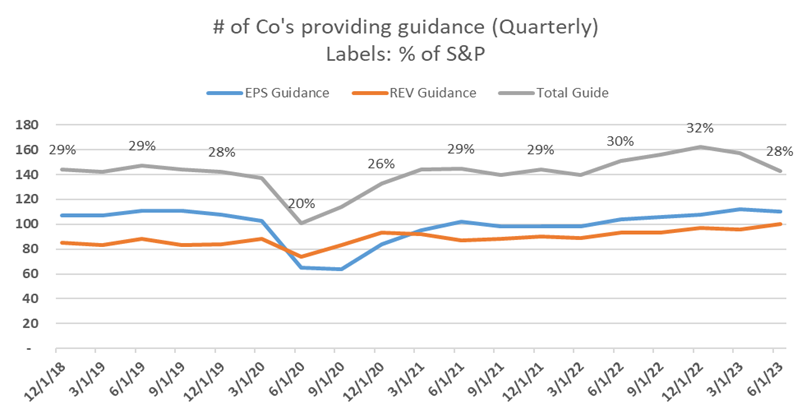
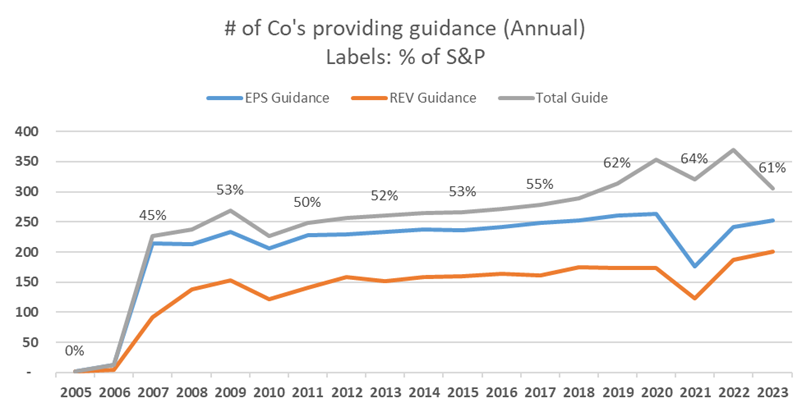
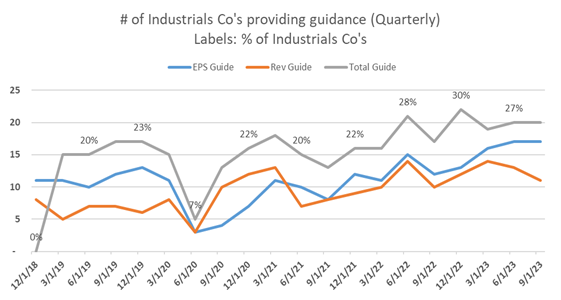
Guidance Continues to Increase After Covid:
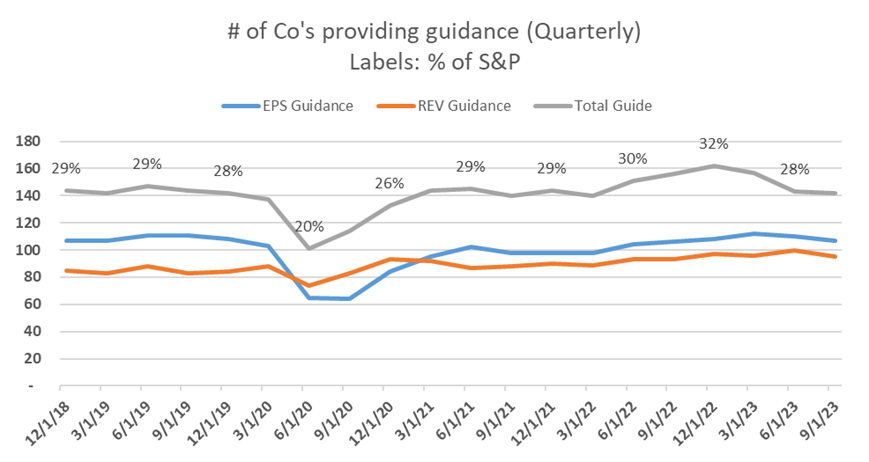
- Quarterly guidance resumed after a dip in Q2’2020, surpassing pre-pandemic levels.
- Approximately 28% or 143 companies have given quarterly guidance as of late Q2’23 reporting.
Q2 Earnings Season Overview:
- 382 companies reported positive earnings surprises, with a 6.7% average earnings surprise and a -0.2% average revenue surprise.
- 81% of companies reported higher actual earnings than Street estimates.
- Positive Earnings Growth in Most Sectors, but Weakness Seen in Energy and Healthcare:
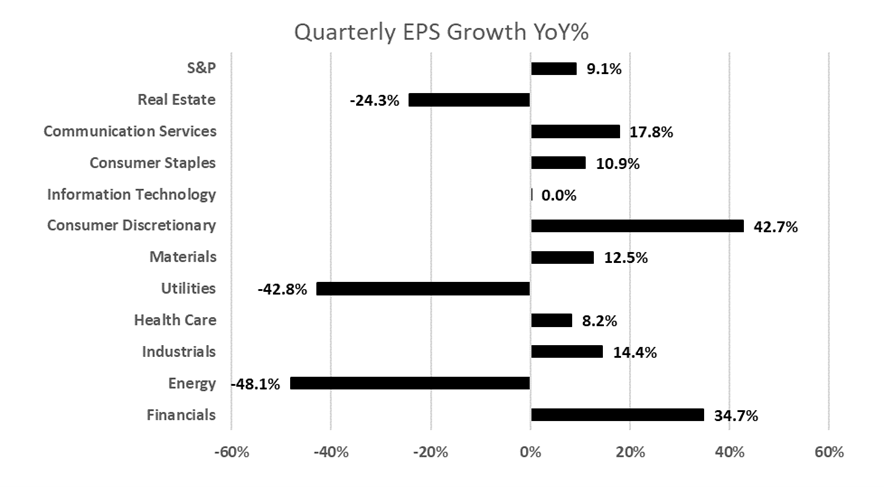
- YoY: 8 out of 11 sectors reported YoY earnings growth, with Consumer Discretionary leading at 42.7%.
- Energy, Utilities, and Real Estate sectors experienced yearly losses.
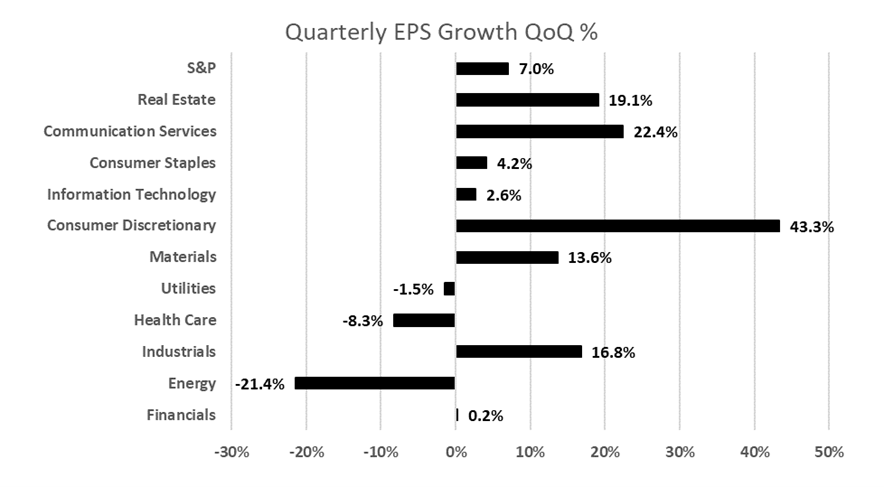
- QoQ: Energy sector saw the largest earnings decline of -21.4% QoQ.
- Healthcare sector’s EPS declined by -8.3% due to Moderna’s and Merck’s negative contributions.
- Revenue Growth Varied Among Sectors:
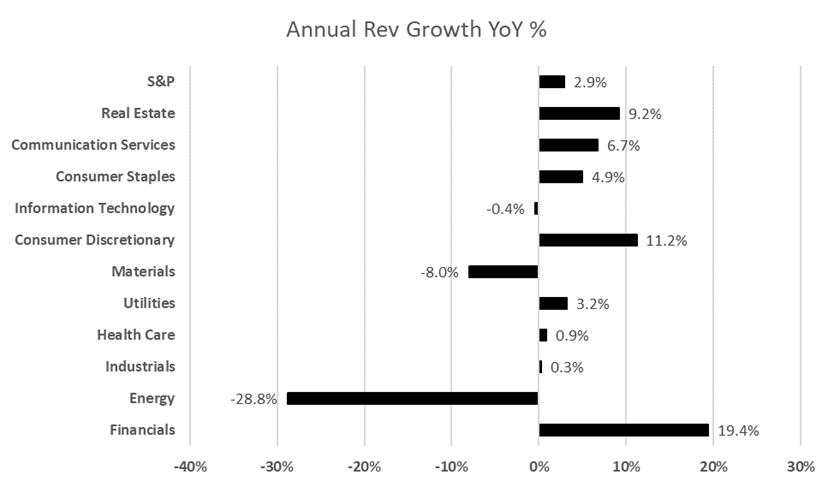
- YoY: Financials sector experienced the highest average revenue growth YoY at 19.4%, with Consumer Discretionary and Real Estate sectors also seeing significant YoY revenue growth.
- Energy sector reported the largest decline in revenues YoY at -28.8%.
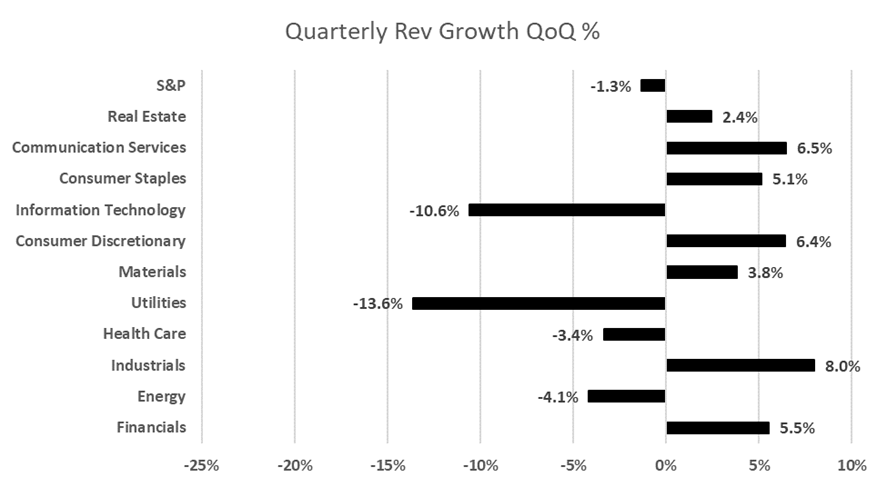
- QoQ: 7/11 sectors reported positive revenue growth, led by Industrials, Communication Services, and Consumer Discretionary.
- Utilities, Tech, and Energy sectors had the worst QoQ revenue growth.
– Sarah Quinlan, Consello Chief Economist
Key Insights
- Earnings: For Q2’23 (95% of S&P 500 companies reporting actual results), 81% of S&P 500 companies have reported a positive EPS surprise and 66% of S&P 500 companies have reported a positive revenue surprise.
- Earnings trends QoQ: For Q2’23, the blended (QoQ) earnings increase for the S&P 500 is 7.0%. The blended (QoQ) revenue decline for the S&P 500 is -1.3%.
- Earnings trends YoY: For Q2’23, the blended (YoY) earnings decline for the S&P 500 is 8.6%. The blended (QoQ) revenue increase for the S&P 500 is 10.2%.
- Quarterly Guidance: For Q3’23, 29 S&P 500 companies have issued negative EPS guidance and 91 S&P 500 companies have issued positive EPS guidance. 30 S&P 500 companies have issued negative revenue guidance and 78 S&P 500 companies have issued positive revenue guidance. We consider negative guidance when guidance for the present period is smaller than guidance from the previous period and vice versa.
- Annual Guidance: For 2023, 63 S&P 500 companies have issued negative EPS guidance and 201 S&P 500 companies have issued positive EPS guidance. 23 S&P 500 companies have issued negative revenue guidance and 200 S&P 500 companies have issued positive revenue guidance.
S&P 500 Companies See Largest Negative Price Reaction to Positive EPS Surprises Since 2011
95% of the companies in the S&P 500 have reported earnings for Q2’23. Of these companies, ~81% have reported EPS higher than consensus. This is slightly higher than quarterly averages over the last three years (79%). Earnings have eclipsed consensus by 6.7% in the quarter, which is below the three-year average of 9.7%. 1
For companies who have reported thus far, YoY earnings declined by 8.6% on average for Q2 2023; this marks the fourth consecutive quarterly earnings decline when comparing each quarter YoY. The -8.6% decline is also well below the five-year average earnings growth rate of 12.0%.
Markets Reacting Negatively on Positive Average EPS / Revenue Surprises
Among the companies reporting this quarter, there’s been an average five-day price decrease of -0.7%. This contrasts with the S&P’s -0.5% dip and sector-specific indices’ -0.3% decline.2 For positive earnings surprises, the average five-day performance was -0.4%, compared to the S&P’s -0.6% and sector ETFs’ +1.4%. Factset research highlights this decrease as notably lower than the five-year 1.0% average price increase for companies with positive earnings surprises. This marks the weakest quarter for trading following positive earnings surprises since Q2’11.3
From a sector perspective, the Consumer Discretionary, Real Estate, and Utilities sectors saw the largest average surprises vs. consensus, eclipsing estimates by 14.1%, 9.9%, and 8.6%, respectively. Within Consumer Discretionary, given Amazon’s 31% weight in the sector and ~86% QoQ EPS surprise, the company was the largest contributor to earnings surprise. Within Real Estate, Prologis (EPS surprise: +128%) and UDR (EPS surprise: +1067%), contributed most positively to the sector’s EPS beat. And within Energy, Targa Resources +4733% EPS surprise most positively affected the sector. If we look further at negative contributors among sectors, the Tech sector saw the largest negative EPS surprise (among companies that saw negative EPS surprises), with Micron (EPS surprise: -186%) and Apple (EPS surprise: -19%) most negatively contributing. Finally, among the S&P constituents, some of the largest names by market cap – Nvidia, Amazon, and Intel, along with companies with outsized EPS growth like Targa Resources, American Airlines and Hasbro – were also the largest contributors to EPS surprise.
Guidance Continues to Increase Since Falling Off Throughout Covid
In terms of guidance, 24 (5%) S&P 500 companies have issued negative EPS guidance for Q2’23, and 96 (19%) S&P 500 companies have issued positive EPS guidance. 23 (5%) S&P 500 companies have issued negative revenue guidance and 85 (17%) S&P 500 companies have issued positive revenue guidance.
For the upcoming Q3’23 quarter, 29 (6%) S&P 500 companies have issued negative EPS guidance, and 91 (18%) S&P 500 companies have issued positive EPS guidance. 30 (6%) S&P 500 companies have issued negative revenue guidance and 78 (16%) S&P 500 companies have issued positive revenue guidance.
One conjecture we were curious about was how guidance trends have changed throughout Covid. While we saw a dip in quarterly guidance in Q2’20 (the first reporting quarter following the global pandemic-led shutdown), the number of companies that have resumed giving quarterly guidance has now surpassed pre-pandemic levels. As of the late stages of Q2’23 reporting, ~28% (143 companies) have given quarterly guidance.4
Q2 Earnings Season: Overview
At this stage of the Q2 earnings season for the S&P 500, the number of companies reporting positive earnings surprises has crept slightly up (from 374 in Q1 to 382 in Q2), while the magnitude of these earnings surprises has increased by ~2%. As a result, as it currently stands, the index is reporting higher earnings for Q2 relative to the end of Q1.
With 95% of companies reporting thus far, 81% have reported higher actual earnings than Street estimates; the amount of positive earnings surprise is above the five-year average of 77% and above the ten-year average of 73%, according to Factset. For the quarter, companies are averaging a +6.7% earnings surprise and -0.2% revenue surprise. This earnings surprise percentage is above the one-year average (+3.2%) but below the five-year average (+8.4%).
Positive EPS Estimates (81% QoQ | 71% YoY) Above Long-Term Averages; Consumer Earnings Positive While Energy Falls After Tougher Comps
Since last quarter, 8 of 11 sectors in the S&P have seen EPS increase with the exceptions of the Utilities, Healthcare, and Energy sectors. The top performing sectors were Consumer Discretionary (43.3% EPS growth QoQ) and Communication Services (22.4% growth). Amazon stood out as it contributed 46.2% to Consumer Discretionary sector growth, with its EPS growing 110% from $0.31 to $0.65 in the quarter. The company also had the second largest impact on growth in the broader S&P 500 with a weighted impact of 28.5%. Quarterly EPS growth in the Communication Services sector was heavily impacted by Alphabet and Meta, which had a combined contribution impact of 55.9% on the sector and 10.8% on the index overall.
The largest declines in EPS QoQ came from the Energy sector, which saw earnings decline -21.4%, and the Healthcare sector, which saw a decline of -8.3%. The Energy sector saw 19 of 23 companies report EPS declines QoQ. Although the sector’s earnings declined considerably, Targa Resources saw a 4,733% growth in EPS, jumping from $0.03 to $1.45 QoQ. The company contributed 167.4% of earnings growth within the sector and was the third largest contributor to growth within the S&P with a 15.8% impact. The Health Care sector’s -8.3% EPS decline was attributable to companies like Moderna and Merck; Moderna’s EPS declined -2,005% from $0.19 in Q1 to -$3.62 in Q2, while Merck saw its EPS decline by -247% from $1.40 to -$2.06. Together, the two companies detracted more from sector EPS than the 41 positive companies contributed. Within the S&P, these two names detracted -18.1% and -14.0%, respectively (2nd and 3rd largest sector-agnostic detractors).
Looking at Q2 earnings YoY, 8 of 11 sectors are reporting YoY earnings growth (similar to QoQ growth, Utilities, Energy, and Real Estate sectors experienced yearly losses in Q2). The Consumer Discretionary sector saw the largest YoY earnings growth in Q2, expanding 42.7%; it also saw the second largest revenue growth YoY at 11.2%. Amazon was the largest contributor to sector EPS growth, making up 60.9% of YoY Q2 EPS growth for the sector. The company’s Q2 EPS increased from -$0.20 in 2022 to $0.65 in 2023, growing 425%. Within the S&P, Amazon was the largest overall contributor, making up 23.0% of the index’s positive YoY EPS growth in Q2. Booking Holdings contributed another 17.6% toward EPS growth within the sector, and 6.6% toward overall growth for the S&P (this was the third largest contribution after Amazon and Nvidia). Booking’s EPS increased by 1650% from $2.15 in Q2’22 to $37.62 in Q2’23. The Financials sector had the second largest annual growth, expanding by 34.7%. Berkshire Hathaway was responsible for 37.3% of the sector’s EPS growth, with EPS increasing by 160% from $1.78 to $4.62 over the last four quarters. The Communication Services sector had the third largest sector growth at 17.8%. This growth was largely due to Alphabet (54.2% of overall sector growth), Meta (40.5% of sector growth), and Charter Communications (12.5% of sector growth). Alphabet’s (Class C) EPS increased by 52% from $0.95 in Q2’22 to $1.44 in Q2’23. Meta’s EPS increased by 86% from $1.60 to $2.98, and Charter Communications’ EPS increased by 309% from $1.97 to $8.05 in the same period.
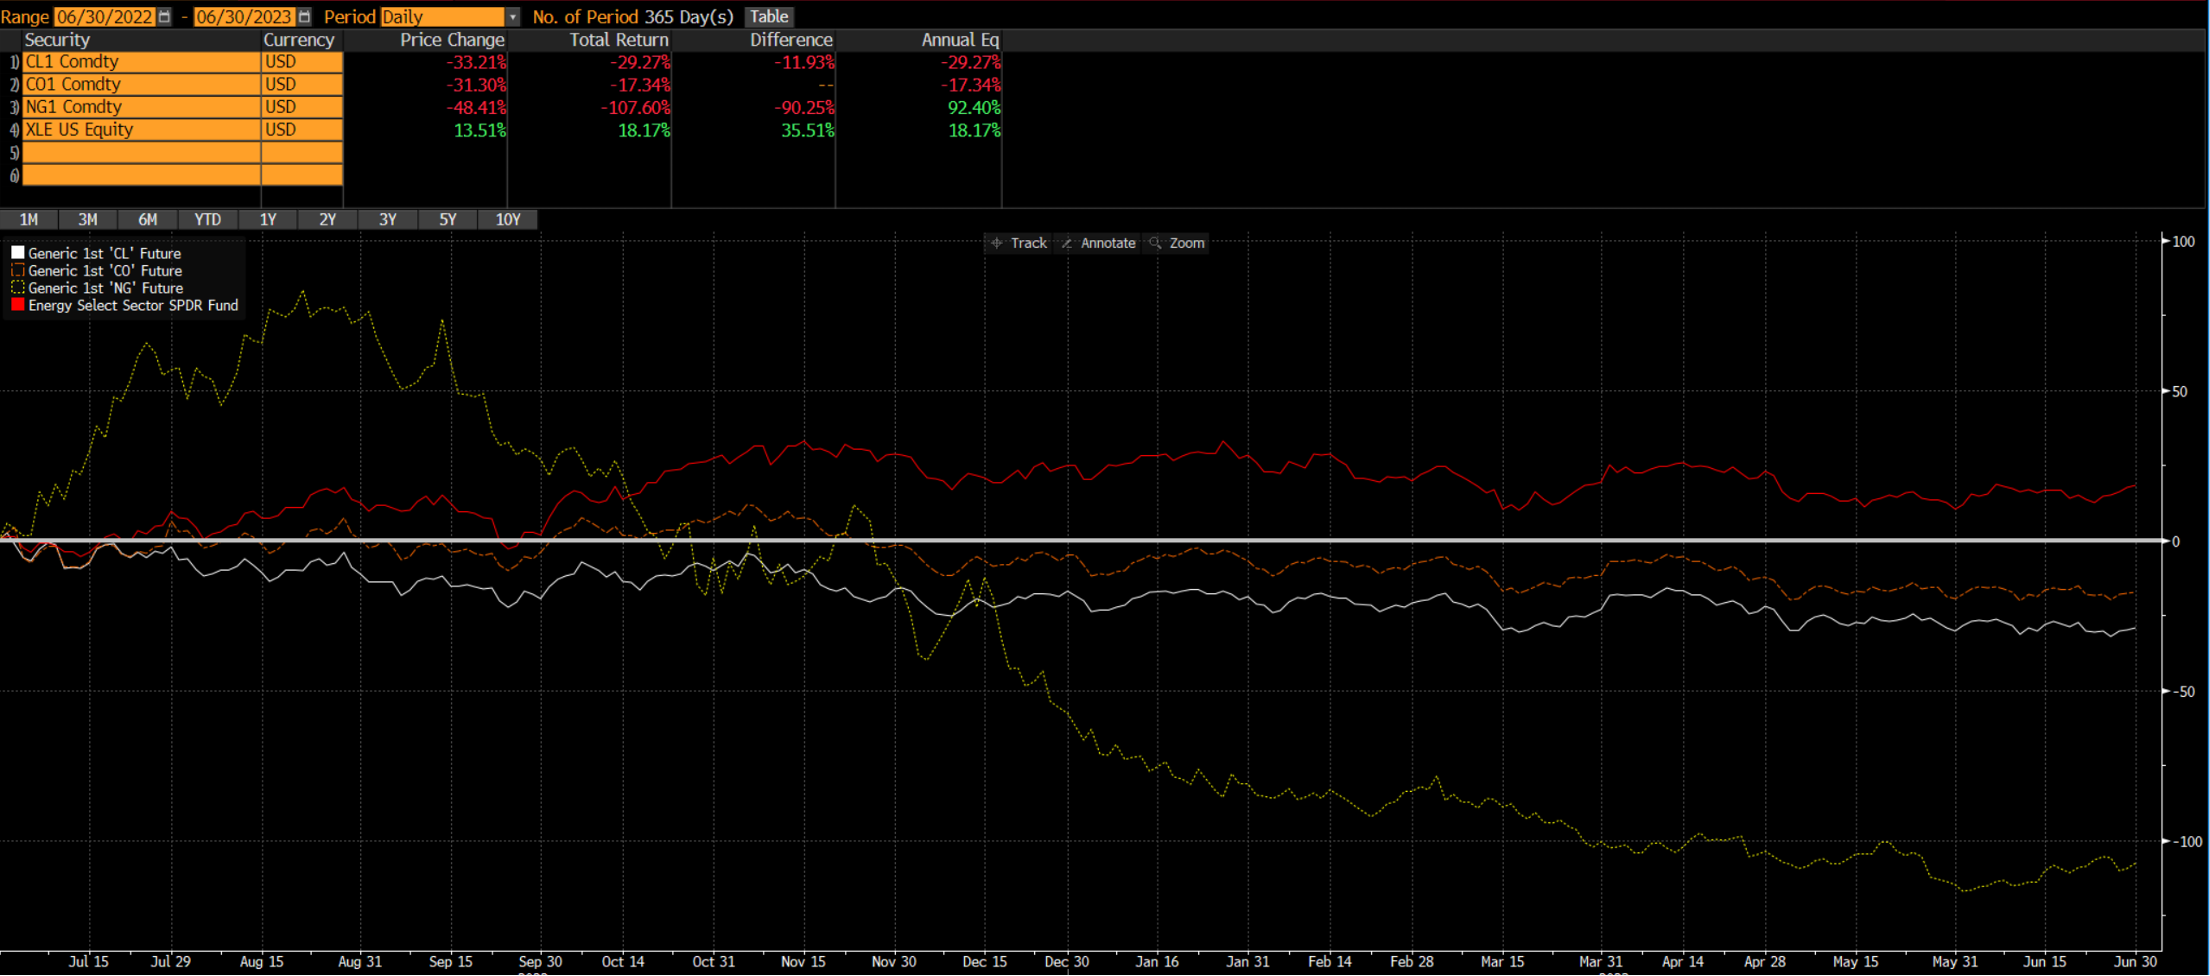
The largest declines for the quarter YoY were in Energy (prices fell ~35% from end of Summer 2022), Utilities, and Real Estate (given higher interest rates). The Energy (-48.1%) and Utilities (-42.8%) sectors have reported the largest YoY declines in earnings. Of the 23 names in the Energy sector, five reported negative YoY EPS growth and 12 reported negative revenue growth. The largest negative contributors were all companies whose stock prices trade in tandem with oil & gas prices. Exxon Mobil, Chevron and EOG Resources, who make up more than half of the sector by market cap (Exxon: 28%, Chevron, 19%, EOG Resources: 5%), saw declines of roughly -53% ($4.14 to $1.94), -47% ($5.82 to $3.08), and -87% ($19.08 to $2.49), respectively, in EPS YoY and -29%, -28%, and -25% declines in revenue, respectively. Meanwhile, during the same period, crude oil declined 33% and liquid natural gas declined 48%.
Within Utilities, nine companies (out of 30) reported negative YoY EPS and 20 companies reported negative revenue. Given its size within the sector, Nextera Energy, which is 15.6% of the sector by weight, contributed -58.5% toward EPS decline YoY within the sector. The company saw Q2 EPS decline by -68% YoY from $2.74 in 2022 to $0.88 in 2023. Finally, Real Estate’s earnings declined by -24.3% (however, revenues increased 9.2% YoY). American Tower (-34.8% contribution) and Digital Realty Trust (-23.5% contribution) were the largest detractors within the sector, with EPS declining by -48% (from $1.95 to $1.02) and -88% (from -$2.99 to $0.37), respectively. Conversely, revenues were up 4% and 20%, respectively, for the two companies during the same period.
Utilities and Tech Drag on Market, Leading to Negative S&P Revenue Declines QoQ; Strong Performance from Financials and Consumer Sectors Positively Impacted YoY S&P Growth
Revenue growth for each sector was somewhat more muted than earnings growth. 7 out of 11 sectors reported positive QoQ revenue growth, led by Industrials (8.0%), Communication Services (6.5%), and Consumer Discretionary (6.4%). Within Industrials, Deere & Co. (96.3%), Boeing (25.6%) and Trane Technologies (24.4%) were responsible for more than 100% of the quarterly revenue growth within the sector. Deere’s revenue increased 41% ($11.4B to $16.1B), Boeing’s revenue increased 10% ($17.9B to $19.8B), and Trane Technologies’ revenue increased 28% ($3.7B to $4.7B). Within the Communication Services sector, as with EPS, Alphabet and Meta were largely responsible for the sector’s positive revenue growth. Alphabet’s revenue increased 7% ($69.8B to $74.6B) while Meta’s increased 12% ($28.6B to $32.0B). Finally, within Consumer Discretionary, Amazon (12.2%), Tesla (9.4%), and Home Depot (7.8%) were responsible for 29% of the sector’s QoQ revenue increase. Amazon’s revenue increased 6% ($127.4B to $134.4B), Home Depot’s revenue increased 15% ($37.3B to $42.9B), and Tesla’s revenue increased 7% ($23.3B to $24.9B).
The three worst performing sectors in terms of revenue growth QoQ were Utilities (-13.6%), Tech (-10.6%), and Energy (-4.1%). Within the Utilities sector, Sempra, Public Service Enterprise Group, Dominion Energy, and Consolidated Edison were the largest detractors from sector revenue. Sempra’s revenues declined by -49% QoQ from $6.6B to $3.3B. Public Service Enterprise Group’s revenues fell by -36% from $3.8B to $2.4B. Dominion Energy’s revenues fell -28% from $5.3B to $3.8. Finally, ConEd’s revenues fell -33% from $4.4B to $2.9B. Together, these companies make up 15.7% of the sector by market cap but were responsible for nearly all the sector’s revenue decline. Overall, the sector saw 25 of its 30 companies with revenue reductions from Q1 to Q2. The second largest revenue decline QoQ was the Tech Sector, which saw revenues decrease by -10.6%. While the sector saw more companies experience revenue growth (42 of 59 companies within the sector (71%) saw revenues increase QoQ), Apple, Broadcom and Micron were significant detractors. Apple contributed ~284% of the sector’s decline, and saw revenues decline 19% from $117.2B to $94.9B (note Apple’s sales are heavily weighted toward the second half of the year due to new product launches in late September). Apple constitutes 7.5% of the sector by market cap, which is why the company’s revenue weighed so heavily on the sector. Apple also weighed heavily on the S&P, as it was responsible for a -34% contribution toward the index’s overall revenue growth. Lastly, the Energy sector also experienced lower revenues QoQ, which is somewhat surprising given how high prices have crept up since the start of the Russia-Ukraine conflict. 17 of 23 companies (71%) have seen revenues dip this quarter, with the largest contribution coming from ConocoPhillips and Exxon Mobil. ConocoPhillips’ revenue slipped -17% in Q2, from $15.5B in Q1 to $12.8B in Q2. Exxon Mobil, which makes up 27.7% of the sector by market cap, saw its revenue decline -4% from $86.6B to $82.9B. Within the S&P, ConocoPhillips was the largest overall detractor, contributing -1.7% of revenue decline.
Looking at Q2 revenues YoY, 8 of 11 sectors are reporting YoY revenue growth. Due to the higher interest rate environment spurred by the Fed raising the federal funds rate ten successive times between March 2022 and May 2023,5 the Financials sector experienced the highest average revenue growth YoY, seeing revenues increase 19.4%. Within the sector, Berkshire Hathaway (88.8% contribution) and JPMorgan Chase (81.5% contribution) contributed the most toward revenue growth. Berkshire Hathaway saw its revenue increase 21% from $76.2B to $92.5B. JPM’s revenue increased 34% from $30.7B to $41.3B. These two companies also constitute 15.1% and 8.6% of the sector by weight, respectively. Within the S&P, Berkshire Hathaway was the second larger contributor to overall revenue growth (+2.9% YoY), contributing 10.5%. The second largest revenue increase was seen in the Consumer Discretionary sector, with 60 of 72 companies (83%) seeing positive revenue increases YoY. Overall, the sector saw 11.2% revenue growth, and was largely aided by Tesla (88.1% contribution) and Amazon (32.6%). Tesla, which is 19.2% of the sector by market cap, saw its revenue increase by 47% (higher Model 3 sales and the launch of three Gigafactories in Berlin, Shanghai, and Texas) from $16.9B to $24.9B YoY. Amazon, which is 31% of the sector by weight, saw its revenue increase 11% from $121.2B to $134.4B. The third largest increase in revenue by sector was within the Real Estate sector, which saw revenues increase by 9.2% on average. 29 of 31 companies (94%) saw revenues increase. The largest contributor to overall sector revenue was Prologis (103.9% contribution), which saw a 51.0% increase in revenues YoY from $1.1B to $1.7B.
Finally, as is consistent with QoQ and YoY earnings trends, Energy saw the largest decrease in revenues YoY, decreasing by -28.8% as a sector. ExxonMobil, Chevron, and ConocoPhillips once again experienced the largest declines in revenue YoY. Exxon Mobil saw its revenue decline by -28% YoY from $115.7B to $82.9B. Chevron saw a -29% decline in revenues from $68.8B to $48.9B. ConocoPhillips saw revenues decline by -41% from $21.9B to $12.9B. Materials saw the second largest decrease in revenues, with -8.0% YoY declines. Within the sector, Dow, LyondellBasell Industries, and Nucor saw the largest revenue declines. Dow saw its revenue decrease by -27% YoY from $15.7B to $11.4B. LyondellBasell Industries’ revenue declined -31% from $14.8B to $10.3B. Finally, Nucor revenue declined -19% YoY from $11.8B to $9.5B.
Sector-Level Commentary
Consumer Discretionary: Highest Earnings Growth QoQ and YoY
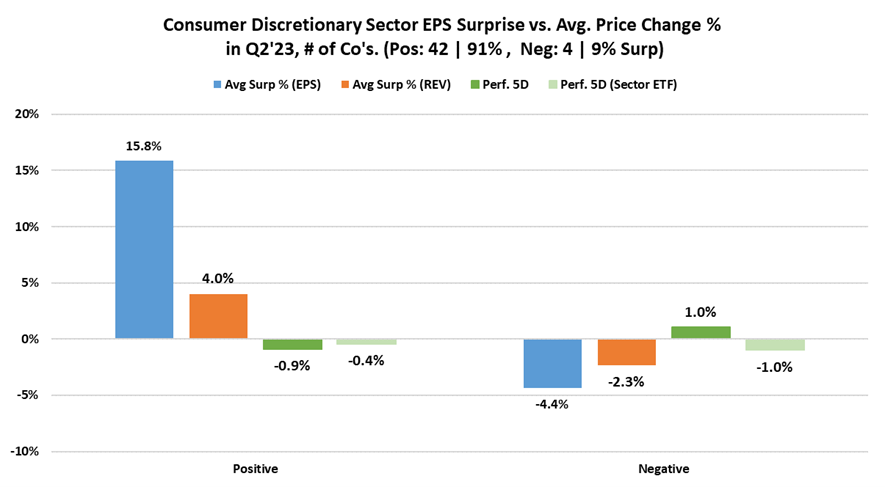
Throughout Q2, the Consumer Discretionary sector displayed robust quarterly EPS increases, recording a +43.3% average increase QoQ and a +24.1% average increase YoY. 91% of companies that have reported earnings thus far (42 out of 46)6 exceeded consensus expectations, resulting in an average EPS surprise of +15.8%. Interestingly, despite this positive surprise, these companies witnessed a marginal decline of -1.2% in their stock price on the earnings date and -0.9% over the subsequent five days. This contrasts with the S&P 500, which experienced only a -0.3% drop on the related earnings date, and the S&P Consumer Discretionary ETF (XLY), which declined by -0.4%. In contrast, 9% (4 out of 46) missed consensus EPS estimates, resulting in an average earnings decline of -4.4%. Nevertheless, these companies saw their stock prices increase by 1.0% over the following five days. On the other hand, the S&P 500 and the XLY both experienced a -1.0% decline over the same five-day period. Prior to the earnings cycle, Consumer Discretionary companies saw their share prices increase on average by 4.4% one month prior to reporting earnings and 11.1% two months prior. This compares to 2.6% and 6.6% for the S&P and 2.3% and 10.4% for the XLY over the same periods.
Similar to the previous quarter, Amazon was once again the largest contributor to earnings growth in Q2.7 The company’s weighted EPS growth contribution within the sector was ~47%; it was also the second largest contributor within all S&P 500 companies, contributing 28.5% to overall S&P EPS growth QoQ. Amazon’s EPS grew 110% from $0.31 in Q1 to $0.65 in Q2. Its stock increased 8.3% on the day of earnings and 7.5% over the following five days. Hasbro, Inc. had the second largest impact on EPS growth in the sector with a 13.6% contribution and was also the fifth largest quarterly EPS growth contributor within the S&P, contributing 8.4% to overall S&P 500 EPS growth.
In terms of quarterly revenue growth (QoQ), the sector grew +6.4% QoQ and had the second largest impact on quarterly revenue growth YoY for the index as the sector grew by +11.5% on average. 33 out of 47 companies that have either reported or shown revenues (70% of the sector) reported positive revenue growth and beat revenue estimates by 4.0% on average. The remaining 14 companies missed revenue expectations by -2.3% on average.
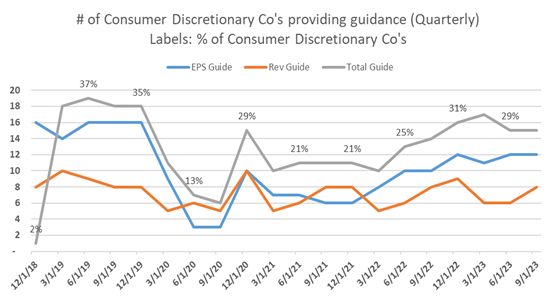
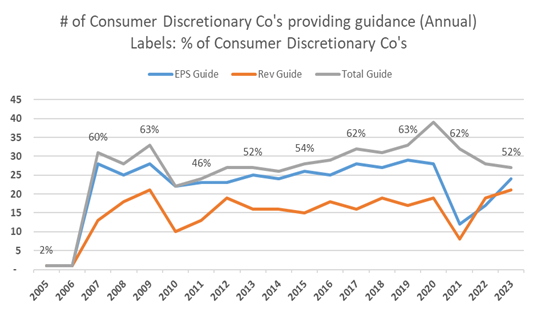
Quarterly guidance trends among Consumer Discretionary companies continued to increase since the drop off during the first year of the COVID-19 pandemic (2020). Currently, 15 companies of 52 in the sector, or 29%, provide quarterly guidance. This is in line with the last five quarters but still stands below the pre-Covid average where ~35% of companies in the sector provided quarterly guidance. For Q3’23, 15 companies have given guidance thus far, equaling the previous quarter. 52% of companies (27 out of 52 companies) reported annual guidance, which is below previous quarters and pre-Covid levels that hovered around 60%.
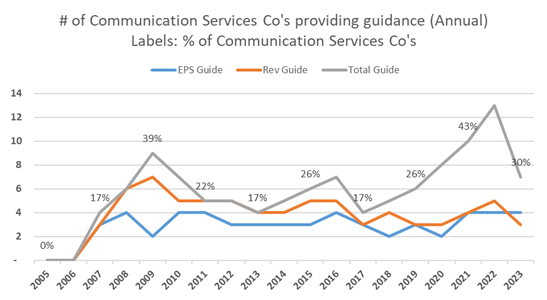
Communication Services: Alphabet and Meta Account for 56% of Sector EPS Growth QoQ
The Communication Services sector had the second largest earnings growth QoQ and YoY, as it did in Q1.8 81% of companies (17 of 21 companies)9 reported positive EPS growth, with three companies contributing ~87% of the sector’s QoQ EPS growth on a cap-weighted basis. Alphabet (both Class A and Class C are in the index, constituting a 7% total weight within the S&P) and Meta contributed 66% and 23%, respectively. Among all companies within the S&P, Alphabet was the seventh largest contributor to QoQ EPS growth with a +6.4% weighted contribution. The company recognized +23% QoQ EPS growth, with EPS jumping from $1.17 to $1.44, while Meta saw EPS growth of +35% from $2.20 in Q1 to $2.98 in Q2.
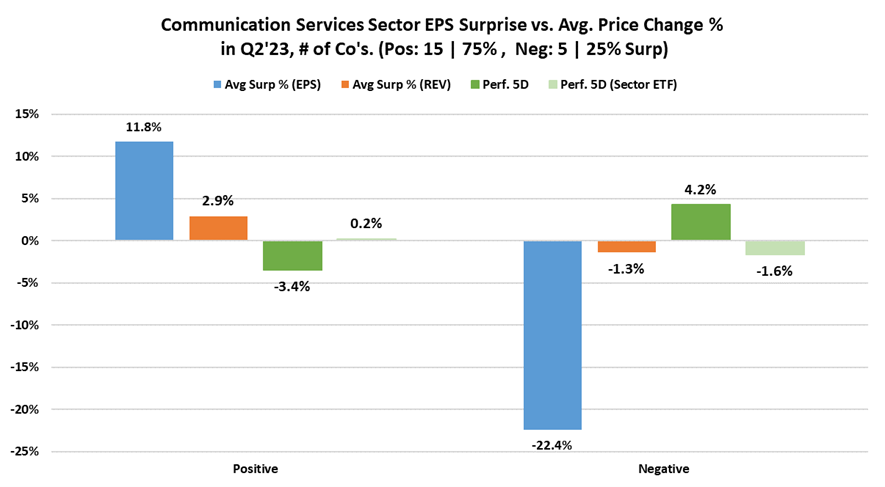
15 companies, or 75% of the sector (reported), beat EPS estimates by 11.8% on average but saw an average decline of -3.4% in stock price over the following five days despite the S&P declining just -0.4% and the sector ETF (XLC) rising +0.2%. In contrast, five companies, or 25% of the sector, missed estimates by -22.4% but saw an average five-day stock price increase of +4.2% compared to the S&P’s -1.5% decline and XLC’s -1.6% decline. Prior to the earnings cycle, Communication Services companies saw their share prices increase on average by 3.4% one month prior to reporting earnings, and 7.6% two months prior. This compares to 3.2% and 7.2% for the S&P and 4.3% and 8.3% for the XLC over the same periods.
The sector had the second largest revenue growth QoQ with +6.5% growth overall, and also had the fifth largest quarterly revenue growth YoY (+8.0%) compared to other sectors. 16 companies reported positive revenue growth (76% of sector), while five companies (24%) reported negative revenue growth. 10 companies, or 48%, beat consensus revenue estimates on average by +2.9% while 11 companies, or 52%, missed consensus estimates by an average of -1.3%. Overall, the sector saw an average revenue surprise of +0.7% in the quarter.
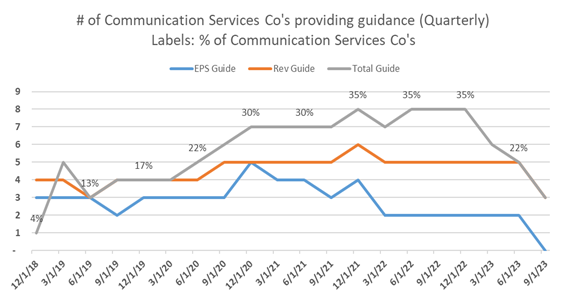
Given the large size and relative maturity of the sector, guidance has remained remarkably steady since Covid began. 22% of companies (5 of 23) provided quarterly guidance, which is slightly below the 30-35% range from the last five quarters. Prior to Covid, four companies provided quarterly guidance. Annual guidance has also largely trended around approximately 25% of companies historically before peaking at 57% (13 out of 23) during FY’22. Thus far, seven companies (30%) have given FY’23 guidance.
Energy: Largest Decline in EPS QoQ
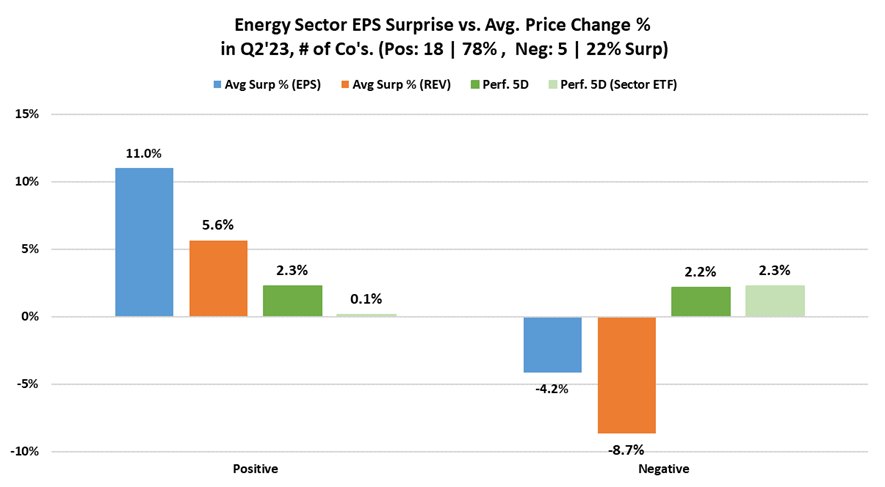
The Energy sector saw an average -21.4% decline in EPS in Q2. With energy prices falling by ~35%, EPS has decreased -48.9% YoY. While 18 of 23 companies (78% of the sector) saw positive EPS surprises QoQ, 19 companies (83% of the sector) experienced negative quarterly earnings growth. Companies who posted EPS beats (only four companies) surprised consensus estimates by 11.0% on average and saw five-day performance of +2.3% vs. S&P performance of -0.8% and sector ETF (XLE) performance of +0.1% over the same period. On the contrary, companies who surprised to the negative missed estimates by -4.2% on average and saw an uncorrelated positive five-day share price bump of 2.2% vs. S&P performance of -0.9% and XLE performance of +2.3% over the same period. Prior to the earnings cycle, Energy companies saw their share prices increase on average by 10.1% one month prior to reporting earnings and 14.2% two months prior, both the highest increases of any sector. This compares to 2.9% and 7.5% for the S&P and 6.9% and 9.2% for the XLE over the same periods.
Overall, the sector beat earnings consensus estimates by 7.7%, but sector performance was largely hampered by ExxonMobil, which constitutes 27.7% of the sector by market cap and experienced an EPS decline of -31% from $2.83 in Q1 to $1.94 in Q2.
In terms of revenues surprises, 11 companies (48% of the sector) beat consensus by an average of 5.6% while 12 companies (52% of the sector) reported lower-than-consensus EPS by an average of -8.7%. Looking at growth rates, 8 companies (26%) reported positive revenue growth QoQ while 17 companies (74%) reported negative revenue growth.
As stated above, ExxonMobil was the largest contributor to sector EPS decline. Chevron and ConocoPhillips contributed -8.0% and -5.8%, respectively, on a 13% QoQ EPS decline from $3.55 in Q1 to $3.08 in Q2 for Chevron and a -23% QoQ EPS decline from $2.80 in Q1 to $1.83 in Q2 for ConocoPhillips. Targa Resources was responsible for ~167% of positive EPS contribution within the sector, with EPS increasing 4,733% ($0.03 to $1.45) QoQ. Targa Resources contributed 15.0% of the S&P 500’s positive EPS growth QoQ (3rd largest contributor), while Exxon detracted -2.7% from total S&P EPS growth (5th largest detractor).
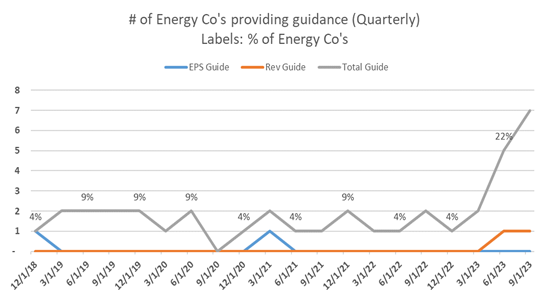
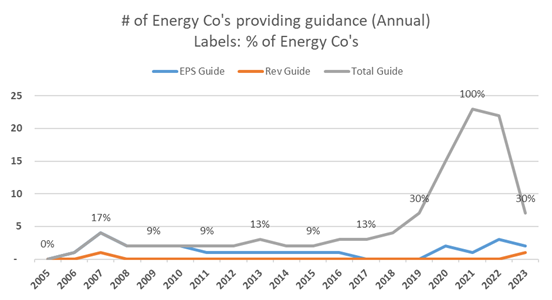
The Energy sector only had 5 of 23 companies (22% of the sector) provide Q2 guidance, which is a significant uptick from previous quarterly trends (normally in the high single digits). Prior to the pandemic, 1-2 companies provided a quarterly outlook. For Q3’23, seven companies (30%) have provided guidance thus far. Since Covid, the number of companies providing annual guidance has seen a steady uptick all the way up to 100% of the sector providing guidance since 2021. Thus far in 2023, seven companies (30%) have provided annual guidance with two quarters left. Notably, the sector largely provides net income and capex guidance versus EPS and revenue figures.
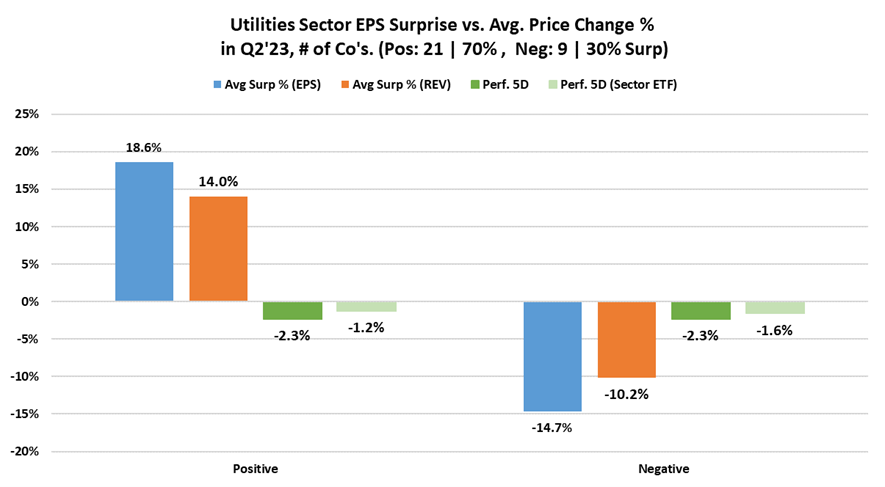
Utilities: Only 10% of Sector Provided EPS Guidance; 0% Provided Revenue Guidance
The Utilities sector saw an average -1.5% decline in EPS in Q2. Given higher inflationary pass-throughs, EPS increased +1.2% YoY. 21 of 30 companies (70% of the sector) beat consensus expectations by an average of +18.6%. However, those companies saw their stock prices drop by an average of -2.3% over the five days post-earnings. The 30% of companies that had a negative EPS surprises missed consensus EPS estimates by an average of -14.7% and experienced similar five-day drawdowns averaging -2.3%. Overall, the sector’s average EPS surprise was 8.6% for the quarter. In terms of revenue surprises, 10 companies (33% of the sector) beat consensus by an average of 14.0%, while 20 companies (67% of the sector) reported lower-than-consensus EPS by an average of -10.2%.
Pinnacle West Capital Corp. and Constellation Energy Corp. together contributed ~131% overall to the EPS growth of the sector, with EPS increasing 3,233% (-$0.03 to $0.94) and 783% ($0.29 to $2.56) QoQ, respectively. However, 19 of 30 (63%) of Utilities companies reported a decline in EPS growth QoQ, negating the positive impact and outsized QoQ growth rates from these two companies. Pinnacle West and Constellation Energy also contributed 10.3% of the S&P 500’s positive EPS growth QoQ. Consolidated Edison and Dominion Energy contributed -10.1% toward the sector’s average earnings decline QoQ. ConEd’s EPS declined -67% from $1.83 in Q1 to $0.61 in Q2. Dominion Energy, which is 4.5% of the sector by weight, saw its EPS decline by -46% from $0.99 in Q1 to -0.53 in Q2. Instead of these two names contributing a large portion of the overall negative earnings decline for the sector, the ~2/3 of companies missing earnings estimates resulted in the overall decline.
In terms of revenue, the sector saw a -2.1% revenue surprise on average. Looking at growth rates, only five companies (17%) reported positive revenue growth QoQ, while 25 (83%) reported negative revenue growth. 10 companies (33%) beat revenue estimates by +14.0% on average, while 19 companies (63%) missed consensus estimates by an average of -10.2%. The limited share price impact from positive EPS and revenue surprises within the sector corresponded to the broader S&P 500 market seeing losses of -1.1% for the positive companies (using an average from the five corresponding dates of the companies that saw positive surprises) and -0.9% for the negative companies. Similarly, the sector ETF (XLU) saw five-day price declines of -1.2% for positive companies and -1.6% for negative companies. Prior to the earnings cycle, Utilities companies saw their share prices increase on average by 2.1% one month prior to reporting earnings and 4.7% two months prior. This compares to 2.9% and 7.2% for the S&P and 1.4% and 3.2% for the XLU over the same periods.
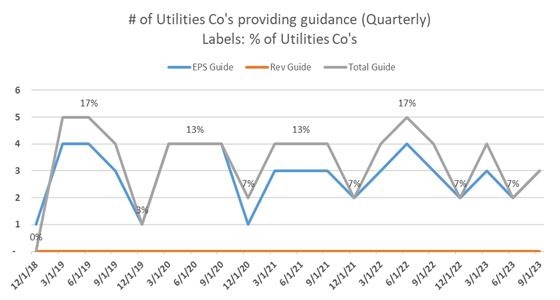
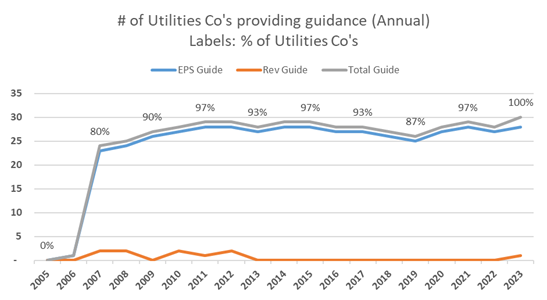
The Utilities sector only had two of 30 companies (7% of the sector) provide Q2 guidance, the lowest share of any sector. For Q3’23, three companies have offered guidance thus far. Prior to the pandemic, 1-4 companies provided quarterly outlooks. However, all 30 companies (100% of the sector) provide annual EPS or revenue guidance (only Pinnacle West gives annual revenue guidance). Since the pandemic, 2-3 companies (WEC Energy, Dominion Energy, and FirstEnergy Corp.) continue to report quarterly guidance, and 29+ companies provided annual guidance, keeping in line with longer-term industry trends. Notably, the sector seldom provides an outlook on revenue, with zero companies providing quarterly revenue guidance and just one providing annual revenue figures.
Industrials: Stock Price Moves in Line with EPS Surprise
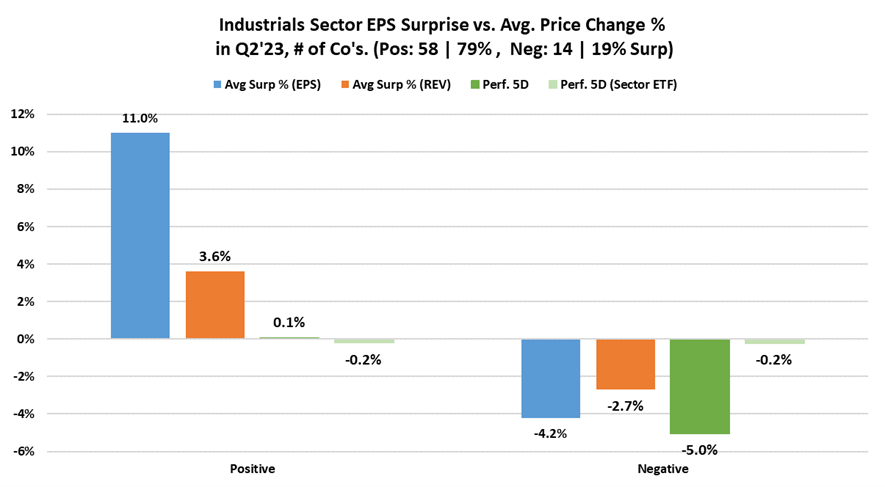
The Industrials sector saw EPS grow by 16.8% in Q2 and by 14.4% YoY on average. The sector beat EPS expectations by an average of 11.0% and saw a minimal price movement of +0.1% five days after earnings, on average. 58 companies (79%) beat EPS consensus by 11.0% on average and saw five-day performance up slightly (0.1%) versus the S&P’s decrease of -0.7% and the sector ETF’s (XLI) decrease of -0.2%. Meanwhile, 14 companies (19%) missed EPS consensus by -4.2% on average and saw an average five-day drawdown of -5.0%. Prior to the earnings cycle, Industrials companies saw their share prices increase an average of 5.0% one month prior to reporting earnings and 13.9% two months prior. This compares to 3.6% and 8.2% for the S&P and 4.3% and 11.3% for the XLI over the same periods.
Overall, the Industrials sector’s average EPS surprise was 8.1% for the quarter. In terms of revenue surprises, 51 companies (70% of the sector) beat consensus by 3.6% while 21 companies (29% of the sector) reported lower-than-consensus EPS by an average of -2.7%.
In terms of growth, 62 of 72 companies (86% of the sector) reported positive EPS growth QoQ while only 10 (14%) reported negative growth. The sector saw 59 companies (82%) report positive revenue growth while 13 companies (18%) saw revenues shrink QoQ. On average, company revenues grew +8.0% QoQ and +0.3% YoY. 51 companies (70%) beat revenue estimates, on average by +3.6%, while 21 companies (29%) missed revenue consensus by -2.7% on average (average sector revenue growth was +1.8% for the quarter). Stock price movements after earnings moved in line with the direction of EPS surprise, in contrast to the other two highest EPS growth sectors.
American Airlines contributed 26.8% of EPS growth to the sector and 8.5% to the S&P overall (5th largest contributor within the S&P). Together with Delta Airlines and General Electric, the three companies contributed ~56% of EPS growth QoQ to the sector and 18% to the broader S&P index. American Airlines’ EPS jumped from $0.05 in Q1 to $1.92 in Q2, an increase of 3,740%. Delta Airlines saw a QoQ EPS increase of 972%, rising from $0.25 to $2.68, and General Electric saw a 152% increase in EPS QoQ from $0.27 to $0.68.
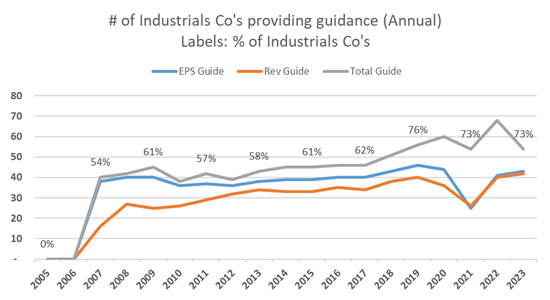
The Industrials sector has seen a steady increase in companies giving guidance since 2018 (both in terms of QoQ and YoY guidance). 20 companies within the sector (27%) have given Q3 guidance this quarter, which is in line with the broader S&P (28% of companies in total provide guidance). Annual guidance has also ticked up into the low 70% range (currently 54 companies (73% of the sector) have provided FY’23 guidance).
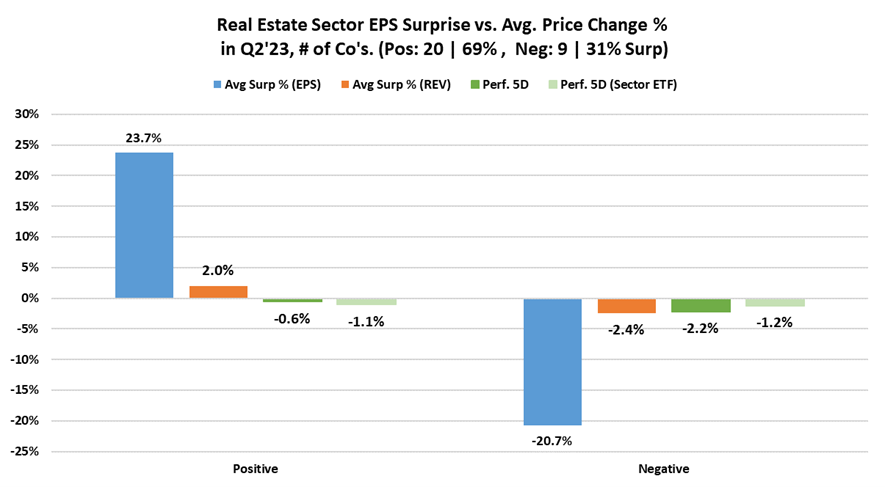
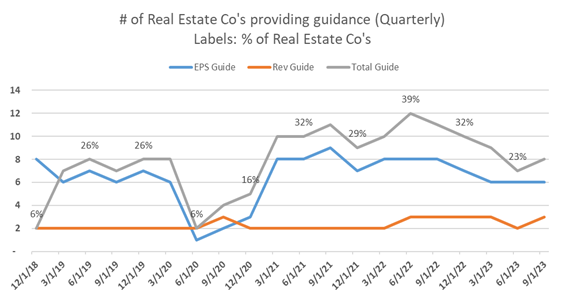
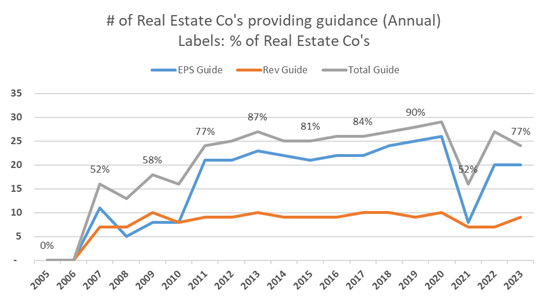
Real Estate: 97% of Sector Reported Positive Revenue Growth QoQ
The Real Estate sector had the third-highest EPS growth at +19.1% on average. In Q2, 69% of Real Estate companies (out of 29 reporting EPS) reported a positive EPS surprise. Of the positive surprises, companies beat consensus by an average of 23.7%. The remaining 9 companies missed consensus EPS estimates by an average of -20.7%. Overall, the sector saw a +9.9% earnings surprise in Q2. Five days after earnings, the positive companies outperformed both the broader market and the sector ETF (XLRE) (-0.6% vs. -0.9% for the S&P 500 and -1.1% for the XLRE). The companies who saw negative earnings versus consensus saw -2.2% five-day returns versus -0.6% for the S&P and -1.2% for the XLRE. Prior to the earnings cycle, Real Estate companies saw their share prices increase an average of 4.2% one month prior to reporting earnings and 10.2% two months prior. This compares to 3.2% and 7.5% for the S&P and 2.7% and 6.8% for the XLRE over the same periods.
At a company level, Prologis, Inc. was the largest contributor to the sector’s QoQ EPS growth with a 28% weighted contribution to the sector. The company reported Q2 EPS of $1.31 versus $0.50 in Q1, an increase of 162%, but saw its price drop -0.8% over the following five days after earnings. Combined with UDR, Inc. (EPS grew 1067% QoQ, from $0.09 in Q1 to $1.05 in Q2), the two companies contributed more than 50% of earnings growth within the sector. Furthermore, Prologis and UDR contributed 3.6% and 2.9% to overall S&P EPS growth QoQ, respectively.
In terms of revenue, the Real Estate sector had quarterly revenue growth of +2.4% QoQ and +9.2% YoY on average. It is worth noting that 30 of the 31 real estate companies (~97%) reported positive revenue growth QoQ. 23 companies (74%) beat revenue estimates by +2.0% on average. On the contrary, 8 companies (26%) missed estimates by an average of -2.4%. Overall, companies within the sector saw an average revenue surprise of 0.9%.
Lastly, in terms of guidance, the number of Real Estate companies providing guidance has steadily decreased throughout the year; at the end of Q2, 23% of the sector (7 companies) reported quarterly guidance compared to 35% (11 companies) from the same period last year. In Q3, the number of companies who have provided guidance has increased to eight companies (26%). During the COVID pandemic, the number of companies providing guidance fell by more than half, dropping YoY from 26% in Q4’19 to 6% in Q2’20. On an annual basis, 77% of companies within the sector have reported FY’23 guidance, which is below the longer-term range of ~85%.
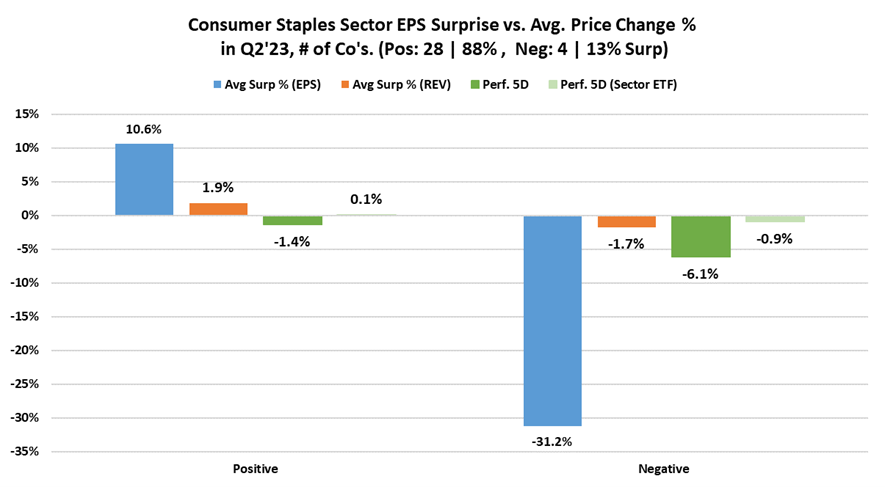
Consumer Staples: Stock Price Declines Post-Earnings Despite Direction of Surprise
The Consumer Staples sector saw EPS grow by 4.2% QoQ and 10.9% YoY on average. 28 out of 32 companies that have reported earnings (88%) reported an average positive EPS surprise of 10.6% with a corresponding -1.4% drop in price over the following five days versus -0.2% for the S&P and 0.1% for the sector ETF (XLP) over the same period. On the contrary, four companies (13%) reported missing consensus by an average of -31.2%. The companies with negative earnings surprises in Q2 saw their share prices fall an average of -6.4% over the five days after reporting earnings versus -0.9% for the S&P and XLP. Overall, the sector’s five-day average performance of +0.1% outperformed both the XLP (+0.0%) and the S&P 500 (+0.0%) after accounting for average five-day price moves after sector company earnings announcements. Prior to the earnings cycle, Consumer Staples companies saw their share prices increase an average of 0.0% one month prior to reporting earnings and 0.2% two months prior, the lowest of any sector per time period. This compares to 2.1% and 6.2% for the S&P and 0.4% and 1.1% for the XLP over the same periods.
Looking at specific contributors to EPS growth, Walmart contributed 38.6% of the sector’s earnings growth QoQ. Walmart’s EPS grew +25% QoQ from $1.47 to $1.84, although the stock saw a -1.3% decline in price over the following five days (vs. -1.0% for the S&P and -3.3% for the XLP). PepsiCo also had an outsized impact on sector earnings growth (36.4%) after seeing 39% EPS growth from $1.50 in Q1 to $2.09 in Q2. In total, the top three contributors, Walmart, PepsiCo and Coca-Cola, contributed to ~89% of the sector’s EPS growth QoQ. On the downside, Tyson detracted the most from quarterly EPS growth as it contributed -5.5% toward the sector’s weighted EPS. Tyson’s EPS declined 105% from $0.85 in Q1 to -$0.04 in Q2 and saw its stock price drop -3.4% over the following five days (vs. -0.1% for the S&P and +0.2% for the XLP).
In terms of revenue, Consumer Staples saw an average of +5.1% revenue growth QoQ and +4.9% YoY. 21 of 32 companies (66%) reported positive revenue growth QoQ while the remaining 34% reported negative revenue growth. 18 companies (56% of the sector) beat consensus estimates by 1.9%, while the remaining 14 companies (44%) missed by -1.7% on average.
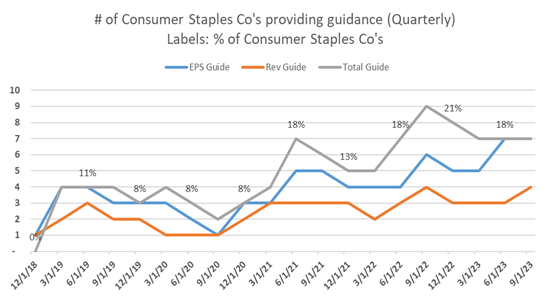
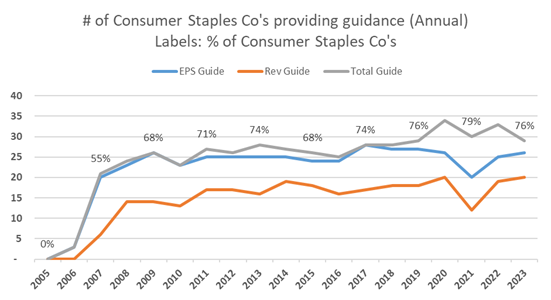
The number of Consumer Staples companies issuing guidance has been steadily rising over the last five years (especially true for quarterly guidance). After September 2020, which marked the quarter with the lowest reported guidance due to macro uncertainty and Covid-related supply chain constraints, the percentage of companies providing guidance has increased from 3% (one company) to 19% (seven companies out of 32 in the sector) in Q2’23. Q3 has also seen ~7 companies provide guidance. Additionally, 76% of companies have issued annual FY2023 guidance. More companies continue to provide earnings guidance compared with revenue guidance, fitting in with longer-term trends.
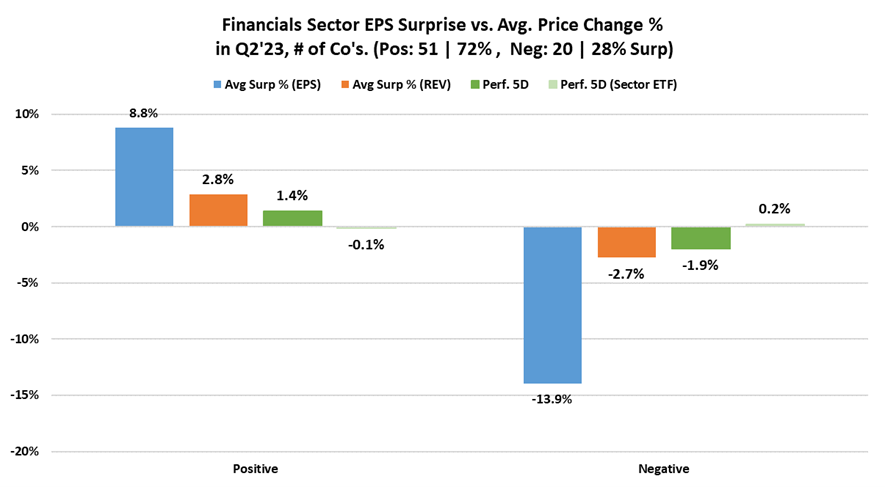
Financials: Large Guns of the Sector (Berkshire Hathaway and JPMorgan) Generated Majority of Sector EPS Growth QoQ
The Financials sector saw a marginal increase in EPS of +0.2% QoQ and +34.7% YoY on average. 51% of the sector (37 companies) reported positive earnings growth, while the remaining 49% (35 companies) reported EPS declines QoQ. Regarding the scale of surprises, 51 companies (72%) had an average 8.8% positive EPS surprise above consensus expectations. 20 companies (28%) saw a negative surprise of -13.9% below expectations on average. Overall, the sector’s company’s saw their earnings surprise to the upside by +2.4% on average. Share prices reacted directionally in line with the earnings surprise in Q2, as stocks with a positive surprise saw an average increase of 1.4% over the five trading days following their earnings report versus a decrease of -0.1% in the sector ETF (XLF) and -0.3% in the broader S&P. Within negative surprises, Financials stocks fell an average of -1.9% in contrast to a +0.2% price change for the XLF and -0.3% for the S&P. Overall, the sector companies saw slightly negative price reactions of -0.1% on average over the five days following their earnings reports, outperforming both the XLF (-0.1%) and S&P (-0.3%) over the same period. Prior to the earnings cycle, Financials companies saw their share prices increase by an average of 6.1% one month prior to reporting earnings and 11.4% two months prior. This compares to 3.4% and 8.2% for the S&P and 5.6% and 9.0% for the XLF over the same periods.
Given its 15.1% weight within the Financials sector, Berkshire Hathaway’s 25.3% QoQ EPS growth (from $3.69 in Q1 to $4.62 in Q2) had a particularly outsized impact on overall weighted EPS in the sector. The company’s share price jumped 3.6% the day after earnings and was up +1.8% after five trading days versus the S&P declining by -0.1% and the XLF seeing no gain over the same period. Other considerable contributions were made by JPMorgan (8.6% weight within the sector; EPS grew by 16% from $4.10 in Q1 to $4.75 in Q2) and American Express (2.6% weight within the sector; EPS grew by 20% from $2.40 in Q1 to $2.89 in Q2). These three companies also saw positive surprises versus consensus, with +24.3%, +20.8%, and +2.7% surprises, respectively. Lastly, these three companies contributed +5.5% toward EPS growth for the entirety of the S&P.
In terms of revenue, the Financials sector had a +5.5% increase QoQ and +19.4% increase YoY on average, which was largely a result of higher interest payments due to the Fed’s ambitions to curtail inflation and tighten monetary policy with ten successive rate hikes between March 2022 and May 2023. 43 companies (60%) had positive revenue growth, while 29 companies (40%) saw negative growth. 49 companies (69%) beat consensus estimates for revenue by +2.8% on average, while 22 companies (31%) missed revenue estimates by -2.7% on average.
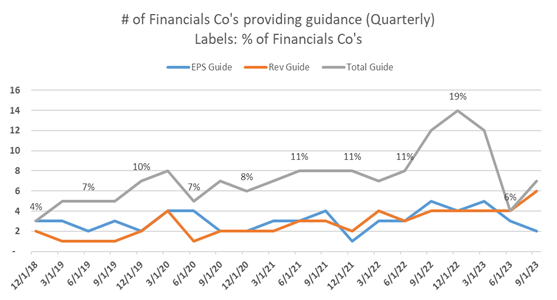
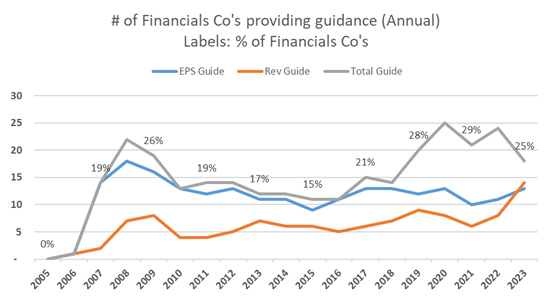
Lastly, in terms of guidance, the sector has seen a decrease in companies issuing guidance YTD, falling from 15% (11 of 72 companies) giving guidance in Q1 to only 6% (four companies) in Q2. For Q3, 10% of companies (7 of 72 companies) have thus far provided an outlook for the quarter. Note, we performed our analysis utilizing other bank-specific metrics like net interest income but the results were in line with EPS and revenue trends. Largely speaking, financial companies have shied away from giving quarterly guidance. However, companies issuing annual guidance have steadily ticked up from the mid-single-digit range after the financial crisis to nearly 30% in the early 2020s. Thus far this year, the number of companies issuing annual guidance has regressed to 25% (18 companies).
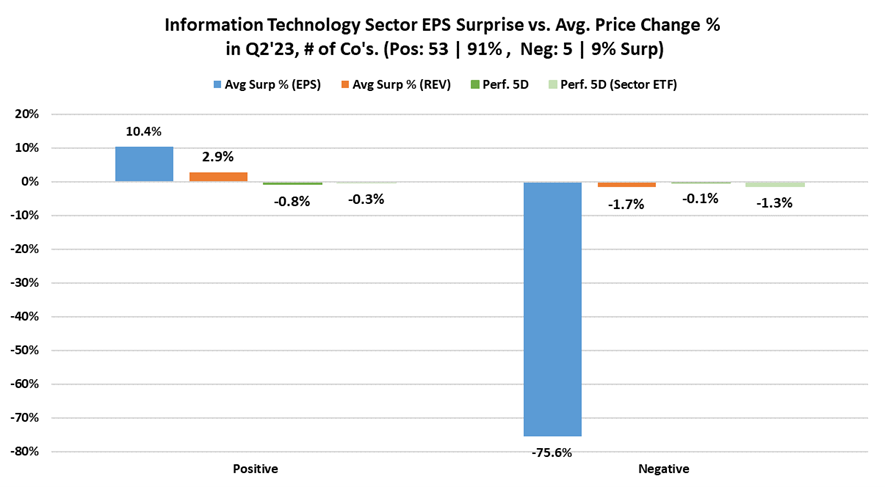
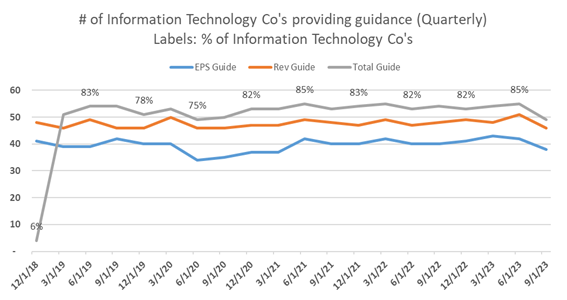
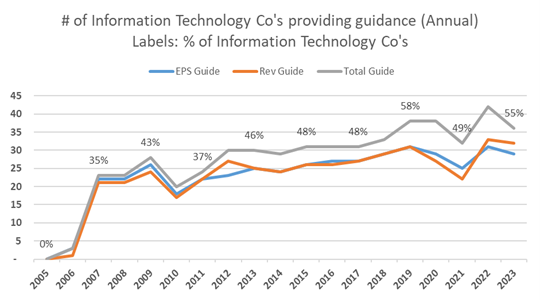
Information Technology: 91% of Companies Beat Consensus Estimates
The Tech sector had the highest percentage of companies exceed EPS estimates and the second highest proportion of companies exceed revenue expectations (second to Health Care), as 53 out of 58 companies that have reported (91%) exceeded expectations while five companies (9%) missed. The average beat for companies in the Tech sector with positive beats was +10.4% but they saw an average stock price decline of -0.8% in the five days following earnings vs. -0.4% for the S&P and -0.2% for the Tech sector ETF (XLK) over the same period. The five companies who missed consensus estimates missed by -75.6% on average but only saw a -0.1% decline in price five days after their earnings announcements vs. 0.0% for the S&P and -1.3% for the XLK over the same period. Prior to the earnings cycle, Technology companies saw their share prices increase by an average of 2.2% one month prior to reporting earnings and 5.8% two months prior. This compares to 2.1% and 6.3% for the S&P and 1.6% and 6.4% for the XLK over the same periods.
Average surprises for the sector were still positive, with the 58 companies seeing a 3.0% quarterly EPS surprise over consensus. In terms of EPS growth, Tech companies saw an average 2.6% increase in EPS from Q1 to Q2 and flat annual increase from Q2 of 2022.
Two companies, Intel and Nvidia, contributed most positively toward EPS growth. Given Nvidia’s significant weight within the sector (9.6%), its 148% EPS growth from $1.09 to $2.70 contributed most positively toward sector EPS (over 100%). Nvidia was also the largest contributor to overall S&P growth QoQ, contributing 30.0% of total S&P earnings growth. Nvidia has continued to shine with the advent of its AI chip technology contributing to the segment’s explosion in recent months. Nvidia’s stock is up 212% YTD. EPS for Intel (1.6% weight within the sector) grew 425% from -$0.04 in Q1 to $0.13 in Q2 and was the second largest contributor within the sector and fourth largest within the S&P (11.5%). Toward the downside, while small in terms of market cap compared to other Tech companies, Micron Technologies (0.6% weight within the sector) missed Q2 EPS estimates by -4675% and saw EPS decline from -$0.04 in Q1 to -$1.91 in Q2. Apple, which comprises 28.1% of the sector by weight, also had negative QoQ growth with EPS declining by 19% from $1.88 in Q1 to $1.52. Together Micron and Apple had approximately ~260% of negative earnings growth contribution QoQ. Like Nvidia, Micron had a significant impact on S&P earnings – the company was the largest detractor from S&P EPS growth in the quarter at -62.5%. Apple was the fourth most negative detractor, contributing -11.4% to the S&P’s overall growth.
In terms of revenue, the Tech sector saw a -10.6% revenue decline QoQ and -0.4% YoY on average. 42 companies (71% of the sector) reported positive revenue growth while 17 companies (29%) reported negative revenue growth. Meanwhile, 48 of 59 companies in the sector (81%) beat consensus estimates by 2.9% on average and 11 companies (19%) missed estimates by -1.7% on average.
The Tech Sector had the highest share of companies issue both quarterly and annual guidance. The sector has hovered in the range of 75-85% of companies issuing quarterly guidance since 2019. In Q2, 85% (55 companies) issued quarterly guidance, accounting for 38% of companies issuing guidance in the S&P overall. For Q3, 49 companies (75%) have issued guidance. On an annual basis, the 55% of Tech companies (36 companies) reporting annual guidance is slightly higher than the ~50% range we’ve seen over the past decade.
Materials: 70% of Sector Saw EPS Growth QoQ
During the quarter, the Materials sector saw an increase in EPS of +13.6% QoQ and +12.5% YoY on average. The Materials sector had 22 of 29 companies (76%) exceed consensus EPS estimates and 11 companies (38%) exceed revenue expectations. Companies with positive surprises exceeded earnings estimates by an average of 15.6% and revenue estimates by 2.5%. Companies who missed their estimates saw earnings missed by an average of -19.6% and revenues missed by -5.9%. Overall, average earnings surprise for the sector was 7.1% and average revenue surprise was -2.7%. In terms of performance, companies with positive surprises saw their stock prices increase by an average of 0.1% over the five days following their earnings reports compared to a decrease of -0.5% in the S&P and 0.0% in the sector ETF (XLB) over the same period. Similarly, companies with negative surprises saw an average decrease of -2.2% in their stock prices over the five days following their earnings reports compared to -0.5% for the S&P and -0.1% for the XLB over the same period. Prior to the earnings cycle, Materials companies saw their share prices increase by an average of 3.7% one month prior to reporting earnings and 8.8% two months prior. This compares to 2.9% and 7.4% for the S&P and 3.2% and 8.8% for the XLB over the same periods.
Sector growth was largely positive, with 20 companies (69%) seeing QoQ earnings growth and 18 companies (62%) seeing positive revenue growth. Martin Marietta Materials, Vulcan Materials, and Sherwin-Williams contributed 73.0% of the sector’s EPS growth QoQ (all around 25% contribution) but are only 13.4% of the sector by weight. Martin Marietta experienced 159% QoQ growth from $2.16 in Q1 to $5.60 in Q2. Vulcan Materials’ EPS grew 141% from $0.95 to $2.29, and Sherwin-Williams EPS grew 61% from $2.04 to $3.29 in the quarter. None of the individual companies had an outsized impact on S&P EPS.
While EPS growth increased QoQ and YoY, revenue declined -8.0% YoY (the sector did experience positive 12.5% revenue growth QoQ). Eleven companies (38% of the sector) exceeded revenue estimates by 2.5% on average while 18 companies (62%) with negative surprises missed by -5.9% on average. Overall, the sector missed quarterly revenue estimates by -2.7%.

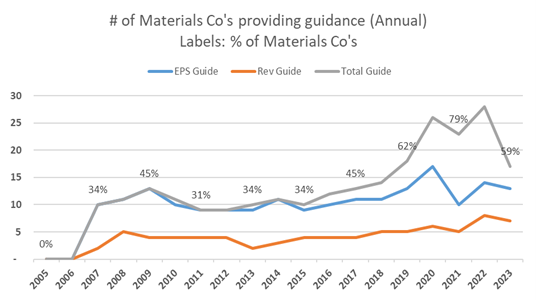
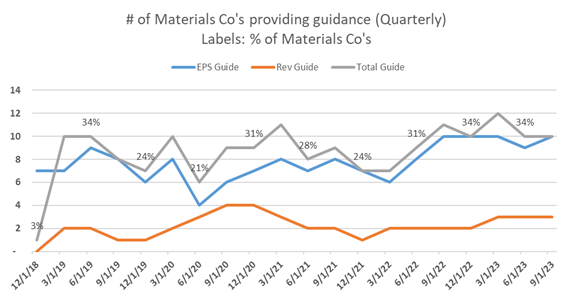
34% of the Materials sector issued guidance this quarter and for Q3 (10 of 29 companies), largely weighted toward EPS guidance (nine companies issued EPS while only three issued revenue guidance). The sector has returned to its pre-Covid quarterly guidance averages of around ~35%. Surprisingly, in 2022, guidance was cut and hovered at around 25% of companies. Annual guidance has steadily increased over the last ten years, reaching a high of 92% in 2022. Currently, with two quarters left in 2023, 17 companies (59%) have issued annual guidance.
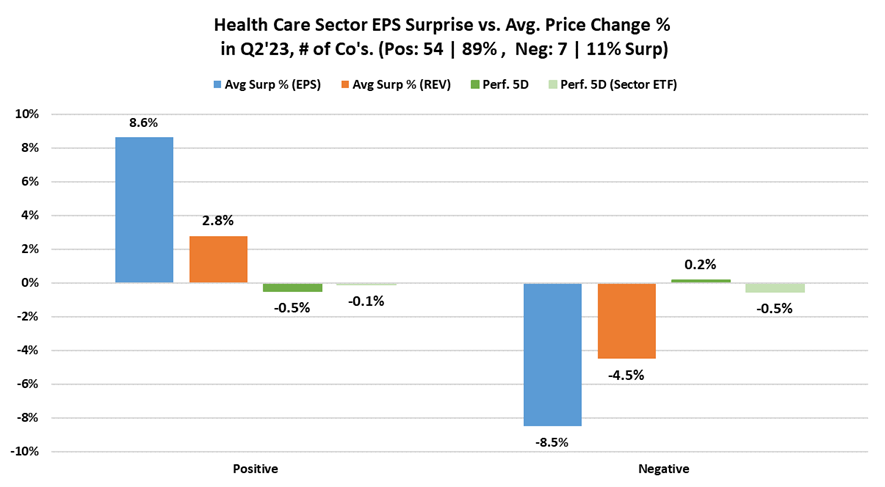
Health Care: Second Largest EPS Decline QoQ
The Health Care sector had 54 of 61 companies who have reported (89%) exceed consensus EPS estimates and 52 companies (84%) exceed revenue expectations, which is the third highest EPS surprise behind Consumer Discretionary and Tech (both at 91% positive EPS surprise) and largest revenue surprise for any sector. Companies with positive surprises exceeded earnings estimates by an average of 8.6% and revenue estimates by 2.8%. Companies who fell below their estimates saw earnings miss by -8.5% and revenues miss by -4.5% on average. Overall average earnings surprise for the sector stood at 6.7% and average revenue surprise was 1.6%. In terms of performance, companies with positive surprises saw their stock prices decrease by an average of -0.5% over the five days following their earnings reports compared to -0.9% for the S&P and -0.1% for the sector ETF (XLV) over the same period. Similarly, companies with negative surprises saw their stock prices decline by an average of -0.2% over the five days following their earnings reports compared to -0.4% for the S&P and -0.5% for the XLV over the same period. Prior to the earnings cycle, Health Care companies saw their share prices increase by an average of 1.2% one month prior to reporting earnings and 5.2% two months prior. This compares to 2.7% and 7.1% for the S&P and 1.9% and 4.3% for the XLV over the same periods.
While sector earnings and revenue surprises were positive, earnings and revenue growth QoQ were negative (largely due to the cyclicality of the sector and 1H having easier comps than 2H). Furthermore, the majority of companies within the sector experienced positive earnings and revenue growth, with 41 companies (66%) seeing earnings growth QoQ and 51 companies (82%) seeing revenues increase QoQ.
Overall, however, the sector’s EPS declined by -8.3% QoQ and -3.4% YoY on average. In terms of company contribution to EPS decline, Moderna and Merck were the largest detractors. Moderna’s EPS declined -2,005% from $0.19 in Q1 to -$3.62 in Q2. Merck saw its EPS decline by -247% from $1.40 to -$2.06. Together, the two companies detracted more from sector EPS than the 41 positive companies contributed. Within the S&P, these two companies detracted -18.1% and -14%, respectively (2nd and 3rd largest sector-agnostic detractors).
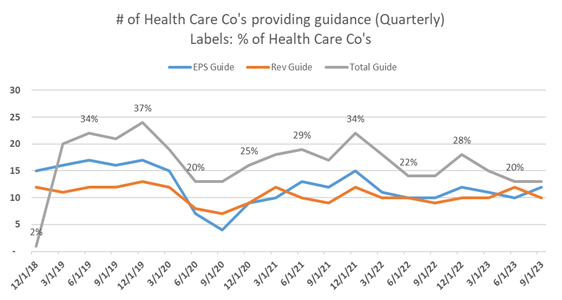
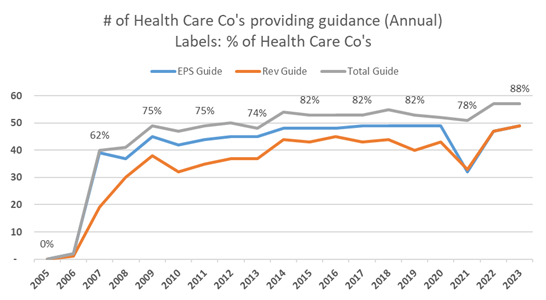
The Health Care sector has seen only 13 of 62 companies (20%) give an outlook on earnings or revenue in Q2 and Q3. In contrast to other sectors, like Consumer Staples and Industrials, Health Care had higher numbers of companies giving guidance before the pandemic, reaching its peak in Q4’22 with 32% of the sector issuing guidance, and falling to its trough in Q3’20 with only eight companies issuing guidance. However, annual sector guidance is now higher than at any point in the last two decades, with 55 companies (88%) providing an outlook for 2024.
1 EPS results were normalized by taking out QoQ surprises greater than 250% and less than -250%.
2 Results calculated by taking average price moves for the companies, the S&P 500, and S&P subsector ETFs over the five days following each company’s earnings announcement. The large caveat here is we are assuming 100% of the price moves are as a direct result of the companies’ earnings; in reality, there are idiosyncratic and correlation risks affecting price moves.
3 https://advantage.factset.com/hubfs/Website/Resources%20Section/Research%20Desk/Earnings%20Insight/EarningsInsight_080423.pdf
4 While not all-encompassing, we define companies giving guidance if they provide an outlook on at least one of the following metrics: EPS, revenue, EBITDA, net income, free cash flow, same store net operating income, or net interest earned (for financial companies).
5 https://www.reuters.com/markets/rates-bonds/fed-hold-rates-steady-signal-policy-path-meeting-this-week-2023-09-19/#:~:text=From%20March%202022%20through%20May,inflation%20since%20the%20early%201980s.
6 The Consumer Discretionary sector has 52 total names in it, with 46 reporting EPS (with an absolute QoQ growth of 250%) and 47 companies reporting revenue as of 9/26/23.
7 Factset
8 Factset
9 The Communication Services sector has a total of 23 companies, with 21 reporting as of 9/26/23.
Disclosures
This paper has been prepared by Consello MB LLC (“Consello”) for the party to whom it has been addressed and delivered and may not be used or relied upon for any purpose other than as specifically contemplated. This paper is based on information provided by or on behalf third parties, from public sources or otherwise reviewed by Consello. Consello assumes no responsibility for independent investigation or verification of such information and has relied on such information being complete and accurate in all material respects. To the extent such information includes estimates and forecasts of future financial performance or events, Consello has assumed that such estimates and forecasts are reasonable. No representation or warranty, express or implied, is made as to the accuracy or completeness of such information and nothing contained herein is, or shall be relied upon as, a representation, whether as to the past, the present or the future. This paper should not be considered a recommendation with respect to any matter. This paper has been developed by and is proprietary to Consello.
This paper was compiled on a confidential basis and not with a view to public disclosure or filing thereof under state or federal securities laws, and may not be reproduced, disseminated, quoted or referred to, in whole or in part, without the prior written consent of Consello.
This paper does not constitute an offer to sell or a solicitation of an offer to purchase any securities and is not a commitment by Consello (or any affiliate) to provide or arrange any financing for any transaction or to purchase any security in connection therewith. This paper may not reflect information known to other professionals in other business areas of Consello and its affiliates.
Consello and its affiliates do not provide legal, accounting or tax advice. Accordingly, any statements contained herein as to tax matters were neither written nor intended by Consello or its affiliates to be used and cannot be used by any taxpayer for the purpose of avoiding tax penalties that may be imposed on such taxpayer. Each person should seek legal, accounting and tax advice based on his, her or its particular circumstances from independent advisors regarding the impact of the transactions or matters described herein.
Broker-dealer services are provided through Pickwick Capital Partners, LLC (Member FINRA and SIPC), 445 Hamilton Avenue, Suite 1102, White Plains, NY 10601, (914) 358-3269.
Opinion and Belief; Forward-Looking Statements
Past performance is not necessarily indicative of future results. Certain statements contained in this paper may be based on current expectations, estimates, projections, opinions and beliefs of Consello. All views expressed and any statements relating to expectations regarding future events represent Consello’s own assessment and interpretation of information available to it as at the date of this paper. Such statements involve known and unknown risks, uncertainties and other factors, and undue reliance should not be placed thereon. Such statements represent solely the opinion or belief of Consello and are not expressed herein as the opinion or belief of any other entity or of members of the Consello team or other persons. No representation is made or assurance given that such statements or views are correct. Opinions expressed and other information or statements herein are subject to change without notice. Any discussion of general market activity, industry or sector trends, or other broad-based economic, market, political or regulatory conditions should not be construed as research or advice.
Additionally, this paper contains “forward-looking statements,” which can be identified by the use of terms such as “may”, “will”, “should”, “expect”, “anticipate”, “project”, “estimate”, “intend”, “see”, “continue,” “target,” “plan” or “believe” (or the negatives thereof) or other variations thereon or comparable terminology or forward-looking context. Furthermore, any projections or other estimates in this paper are “forward-looking statements” and are based upon certain assumptions that may change. Due to various risks and uncertainties, actual events may differ materially from those reflected or contemplated in such forward-looking statements. Moreover, actual events are difficult to project and often depend upon factors that are beyond the control of Consello and its affiliates. Recipients of this paper should not rely on such forward-looking statements, and no representation or warranty is made as to future events or results or such forward-looking statements. Nothing in this paper constitutes a guarantee, projection or prediction of future events or results.
Unless otherwise noted, information in this paper is presented as of the date hereof and does not reflect any facts, events or circumstances that may have arisen after that date, is subject to discussion, completion and amendment and does not contain all information necessary to fully evaluate any transaction. Neither Consello nor any other person has any obligation to update this paper (including forward-looking statements herein) or correct inaccuracies or omissions in it.
Copyright © 2023 Consello MB LLC. All rights reserved.