Executive Summary:
- After four straight quarters of YoY profit declines, the Q3 earnings season marked a return to YoY earnings growth.1 In the spirit of a stronger earnings season, 82% of S&P 500 companies exceeded EPS estimates – the highest beat rate since Q3 2021. However, upside surprises were more muted at +7.0% above estimates (behind the +8.5% five-year average surprise). A low revenue surprise of +0.1% suggests that more upside is coming from expense management versus topline growth.
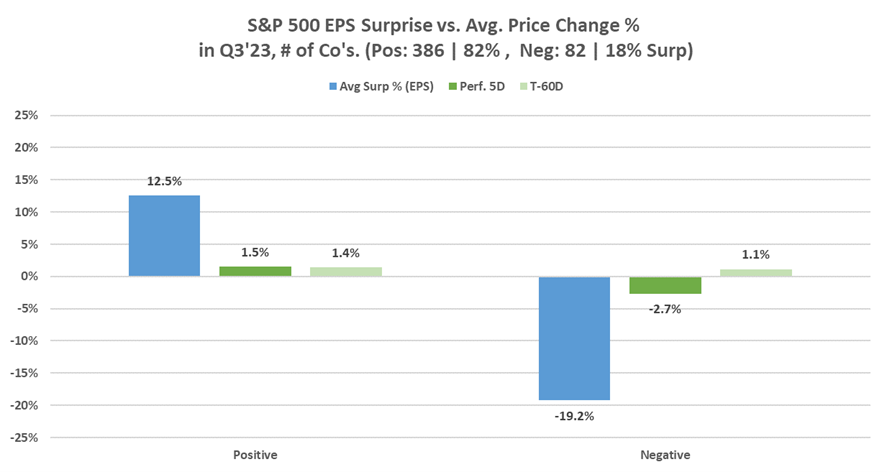
- Headed into earnings, on average share prices dropped 3.3% in the month before this quarter’s earnings announcements. Despite widespread EPS upside compared to estimates, stocks reacted with notable polarization between those beating and missing expectations. On average,2 positive earnings upside surprises yielded a positive (but below historical average) +0.7% stock price reaction over the following five days – half of the 1.3% long-term average.3 Notably, stocks rose with earnings beats this quarter, while they fell with earnings beats in Q2. Importantly, misses were punished more heavily than beats were rewarded, as earnings misses, on average, prompted an outsized -2.7% stock decline for companies with negative surprises.
- Growth varied by sector. While Q3 brought an 11.4% earnings growth rebound YoY, momentum concentrated sharply in pockets such as the Technology and Consumer Discretionary sectors, while Real Estate and Energy faced ongoing hurdles with profits falling over 40% amidst rising rates, slowing demand, and lower oil prices.
- The number of companies choosing to provide guidance also remained in flux, down 25% from post-pandemic peaks. 4
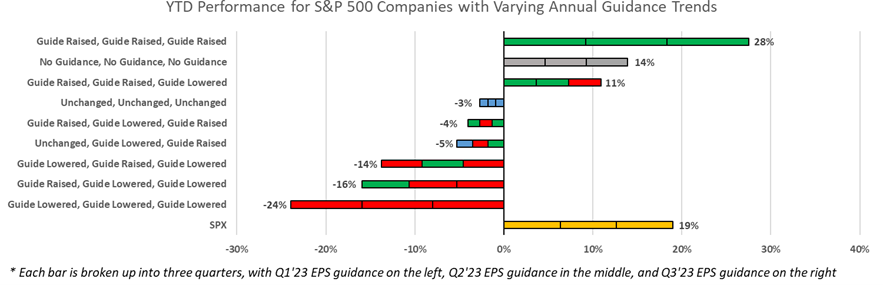
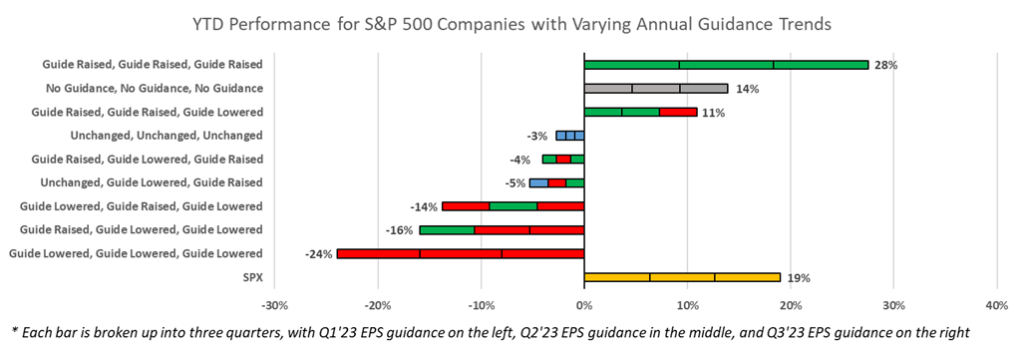
- In exploring the theme and magnitude of whether investors reward consistency and upside surprise in guidance, we assessed the differences in performance of stocks across multiple EPS guidance revision scenarios. Using weighted average returns,5 our findings show companies that raised annual forecasts through all four quarters saw high YTD share price gains (+28%). However, companies that lowered expectations at any point underperformed, even including those that guided up following a lowered bar – with losses as high as -24% YTD among serial downward adjusters. We also observed three key trends:
- Variance in YTD returns is high in Q3 – While the market rewarded upside while penalizing downside as expected, the magnitude expanded in Q3 and the market was increasingly punitive to downside surprises. Consistent guidance increases for each quarter this year led to 9% outperformance, while consistent guidance declines led to -43% underperformance relative to the S&P 500.
- High recency bias in Q3 – Guidance reductions in the later part of 2023 have faced greater penalties due to recency bias, while recent increases in guidance have resulted in more significant outperformance compared to earlier in the year.
- Momentum growing in Q3 – Maintaining consistent guidance throughout the year resulted in underperformance (-3%), trailing behind companies that refrained from providing guidance (+11%) altogether, and particularly those that revised their guidance upward.
Coming out of Q3 2023, where companies that positively surprised / raised their earnings guidance were rewarded and companies that missed / lowered guidance were punished more, and with the S&P +19% YTD, the bar for outperformance appears higher into year end, highlighting the importance of guidance processes and proactive management of expectations.
 Source: FactSet 6
Specific Q3 Earnings Highlights
S&P 500 Companies See Highest Percentage of Companies Beating EPS Since 2021:
- 82% of S&P 500 companies have reported a positive EPS surprise (EPS higher than consensus), which is above the five-year average of 77% and above the ten-year average of 74%. 61% of S&P 500 companies have reported a positive revenue surprise.
- This is the highest percentage of S&P 500 companies reporting a positive EPS surprise since Q3 2021 (82%).
- In aggregate, companies are reporting earnings that are 7.0% above estimates, which is below the five-year average of 8.5%, but above the ten-year average of 6.6%.
- YoY earnings and revenue growth for the S&P in Q3 2023 are 11.4% and 5.1%, respectively, which is significantly higher than the -8.6% earnings decline but lower than the 10.2% revenue growth seen in Q2.
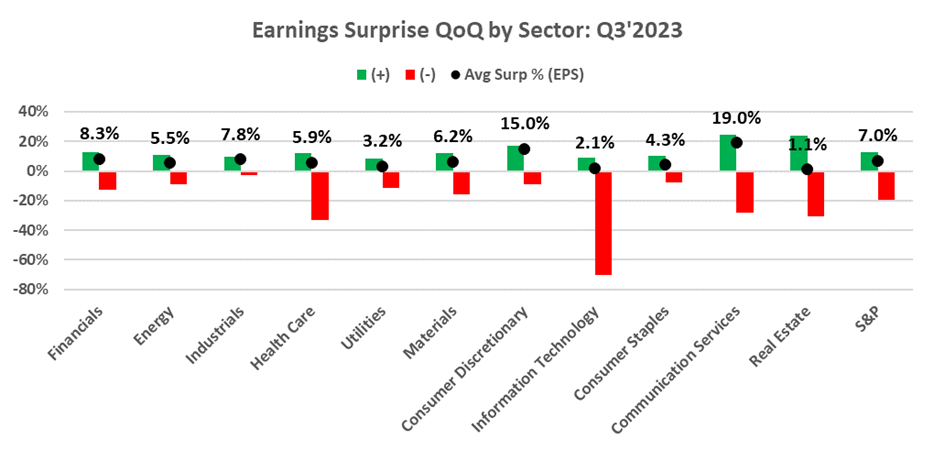
All Sectors Seeing Positive Earnings Surprises, Revenue Surprises More Muted:
- All 11 sectors experienced positive earnings surprises vs. consensus, led by the Communication Services (19.0%) and Consumer Discretionary (15.0%) sectors, which had the largest average positive surprises vs. consensus.
- Revenue surprises have been far more muted than EPS; the weighted average S&P 500 revenue surprise was 0.1% in Q3. Utilities (-7.3%) and Materials (-1.1%) exhibited the most substantial weighted negative EPS surprise on average.
Stock Reactions
- Companies experienced a weighted average five-day post-reporting price increase of 0.7%, slightly lower than the five-year average of 1.0%, but better than the negative -0.7% response in Q2.
- Heading into earnings:
- Reporting companies’ shares decreased a weighted average of 3.3% a month prior to earnings (+4.6% for companies that reported positive earnings and -6.5% for those that reported negative results). Looking further at a two-month horizon, S&P constituents were down -6.5% on average (+4.9% for positive surprises and -9.5% for negative earnings).
- The one-month and two-month price growth is trailing behind the -1.5% and -4.0% growth observed for the S&P 500 and the -1.9% and -4.7% growth of all 11-subsector ETFs during the same periods.
Q3 Earnings Season Overview:
- 386 companies reported positive earnings surprises, with a 7.0% weighted average earnings surprise and a 0.1% weighted average revenue surprise. 82% of companies reported higher actual earnings than Street estimates.
- Positive Earnings Growth in Most Sectors, but Weakness Seen in Energy and Healthcare:
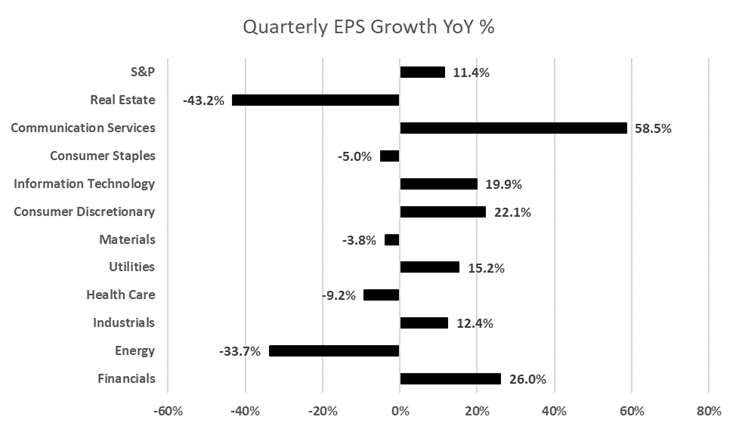
- 6 out of 11 sectors reported YoY earnings growth, with Communication Services leading at 58.5%, while Real Estate (-43.2%) and Energy (-33.7%) sectors experienced the largest yearly losses.
- Two tech companies alone contributed over 50% of weighted EPS growth for the S&P 500. In addition, other large detractors include several Real Estate and Energy names.
- Revenue Growth Varied Among Sectors:
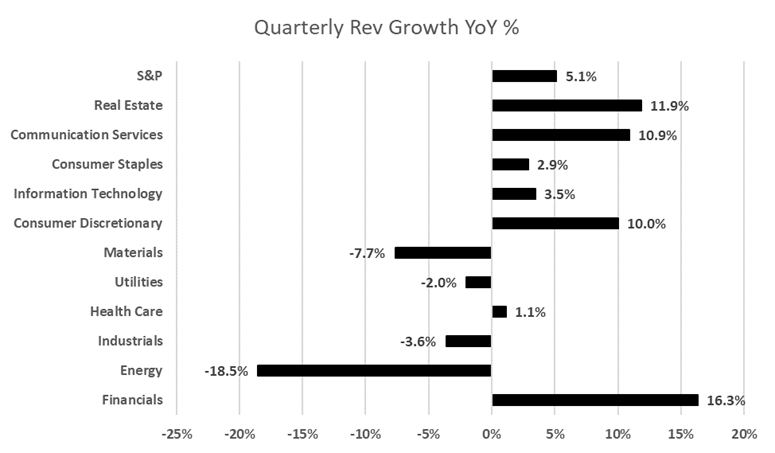
- Financials (16.3%), Real Estate (11.9%) and Communication Services (10.9%) experienced the highest average revenue growth YoY. Once again, the Energy sector reported largest revenue declines YoY (-18.5%).
Q3 Economic Commentary
- November was the 22nd consecutive month with an unemployment rate below 4%. The payroll report showed slower payroll growth, rising unemployment and slower average hourly earnings growth.
- The U.S. Department of Labor’s Nov. 3 Employment Situation Report for October posted a weaker-than-expected number on job creation (+150,000 new vs. +180,000 consensus).
- The unemployment rate ticked higher to 3.9% (+3.8% consensus) and average hourly wage growth on a month-over-month basis slowed to +0.2% (+0.3% in September). The labor force participation rate declined from 62.8% in September to 62.7%.
- November headline CPI was up +0.1% from October (above consensus of +0.0%). On an annualized basis, total CPI rose 3.1% (in line with consensus +3.1%) versus 3.2% in October – reinforcing the disinflation narrative.
- Continuing with the disinflation narrative, October PPI declined 0.5% (consensus +0.1%) and was the largest decrease in final demand prices since April 2020.
- The U.S. Department of Commerce’s second estimate for Q3 2023 GDP showed strong growth at +5.2% (consensus was +5.0%), better than the advance estimate of +4.9%. Despite higher interest rates, the U.S. economy grew at an even stronger pace than expected, aided by a tight labor market and disinflation.
- The PCE price index, which is the Federal Reserve’s preferred measure of inflation, declined in October, the latest sign that price increases are slowing down but are still above the 2% Fed target rate.
Q3 Insights
- Earnings: For 3Q 2023, 82% of S&P 500 companies have reported a positive EPS surprise and 61% of S&P 500 companies have reported a positive revenue surprise.
- Earnings trends QoQ: For 3Q 2023, the blended (QoQ) earnings increase for the S&P 500 is 8.8%. The blended (QoQ) revenue decline for the S&P 500 is -1.2%.
- Earnings trends YoY: For 3Q 2023, the blended (YoY) earnings increase for the S&P 500 is 11.4%. The blended (QoQ) revenue increase for the S&P 500 is 5.1%.
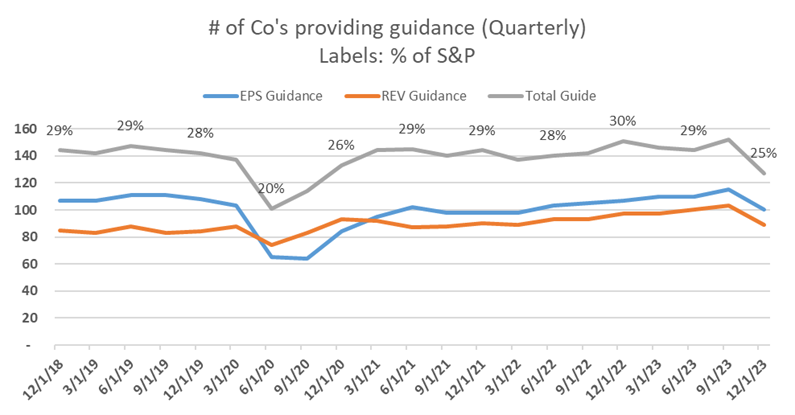
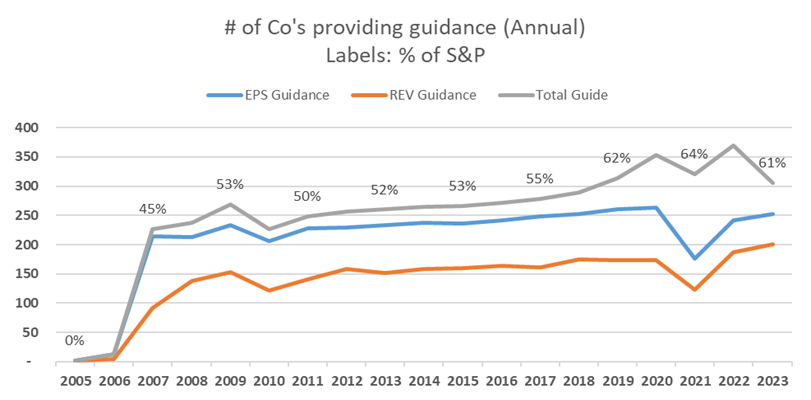
- Guidance: Number of companies providing guidance slightly below previous quarters, but continues to increase after Covid (Q4 Guidance: 127 companies, Annual 2023 Guidance: 275 companies)7 :
- 100 companies in the index have issued EPS guidance for Q4 2023, and 127 companies have given Q4 guidance of any sort; the total number of companies providing guidance (currently 25% of the S&P) is slightly below prior quarters (28-30%).
- 309 companies in the index have issued EPS guidance for the current fiscal year (FY 2023 or FY 2024).
- 155 companies have issued positive guidance (guidance raised in the quarter or kept unchanged following a raise in the previous quarter) and 92 have issued negative EPS guidance (guidance lowered in the quarter or kept unchanged following a decrease in the previous quarter).
- Companies that issued positive guidance are seeing higher YTD returns (+2.4%) versus companies that have lowered guidance (-0.1%).
 Source: FactSet 8
 Source: FactSet 9
S&P 500 Companies see more Punitive Share Price Performance Following Negative Earnings Surprises
~82% of S&P 500 companies have reported a positive EPS surprise (EPS higher than consensus), which is above the five-year average of 77% and above the ten-year average of 74%. 61% of S&P 500 companies have reported a positive revenue surprise.
For companies that have reported thus far, YoY earnings increased by 11.4% on average for Q3 2023; this marks a stark reversal of the previous four quarters that saw earnings decline when comparing each quarter YoY. The 11.4% earnings growth is still below the five-year average earnings growth rate of 12.0%.
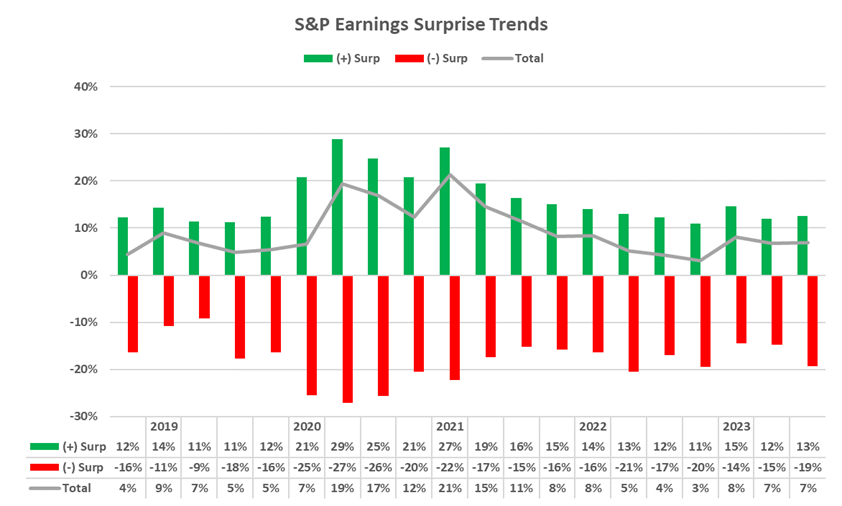
On average, the size of earnings surprises has increased compared to Q2 (weighted average positive surprises for S&P 500 companies was 13% in the quarter versus 12% in Q2 and was -19% for negative surprises in the quarter, compared to -15% in Q2).
 Source: FactSet 10
Markets Reacting Negatively on EPS / Revenue Surprises more than Long-Term Averages
Among the companies reporting this quarter, the market is rewarding positive results and penalizing negative results more than long-term averages. For the 94% of companies that have reported, there has been an average five-day price increase of 0.7%, which is below the S&P 500’s 1.3% five-day move and sector-specific indices’ 0.8% increase. 11
For positive earnings surprises, the average five-day performance was 1.5%, which is larger than the five-year average move of 0.9%. In comparison, the S&P was up +2.7% and sector ETFs were up +2.8% during the same time window. Markets rewarded the Real Estate and Communication Services sectors the most with +23.6% and +24.2% EPS surprises seeing +4.0% and +2.5% five-day share price increases.
For negative earnings surprises, the average five-day performance was -2.7%, and is also lower than the 5-year average quarterly move of -2.3%. During the same time window, the S&P was down -2.0% and sector ETFs were down -2.2%. Markets punished companies within the Energy and Financial sectors that missed on EPS with the largest negative price moves, with the average negative EPS surprise of -12.9% within the Financial sector seeing -4.6% five-day price moves, and -12.9% within the Energy sector seeing -5.0% five-day price moves.
 Source: FactSet 12
Source: FactSet 13
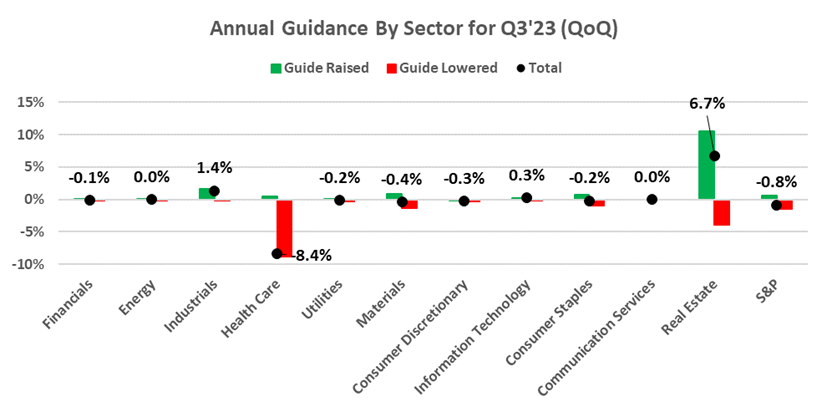
Number of Companies Providing Guidance Slightly Down from Post-Covid Peak
The number of S&P 500 companies providing quarterly forecasts ticked down slightly to 25% (127 companies) from post-pandemic peaks of nearly 30%. Similarly, the number of companies providing annual guidance marginally decreased as well to 61% of the S&P (275 companies).
Of the sample set,100 companies in the index have issued EPS guidance for Q4 2023, and 127 companies have given Q4 guidance of any sort; 309 companies in the index have issued EPS guidance for the current fiscal year (FY 2023 or FY 2024). 155 have issued positive guidance (guidance raised in the quarter or kept unchanged following a raise in the previous quarter) and 92 have issued negative EPS guidance (guidance lowered in the quarter or kept unchanged following a decrease in the previous quarter). Among positive guidance raises in the quarter, Real Estate was the largest beneficiary seeing average annual guidance raised by 10.6%. Meanwhile the Healthcare sector saw the largest pullback in guidance with an average reduction in annual guidance of -8.8%.
Source: FactSet
Stock Performance Relative to Guidance Revisions
This quarter, we also analyzed how company share prices are affected by guidance revisions throughout the year. The following graph shows YTD average stock return of companies that have had differentiated guidance, across various scenarios. Each quarter, a company either revised guidance upwards/downwards or kept guidance the same as in the prior quarter. Unsurprisingly, companies that raised guidance throughout 2023 (every quarter) outperformed both the broader S&P 500 index (on average, companies that raised guidance each quarter are up 28% YTD vs. the S&P, which is up 19% as of 11/30/23). Conversely, companies that lowered guidance every quarter saw their share prices decrease by -24% YTD, on average. Additional trends that we have observed include:
- Variance in YTD returns is significantly high into Q3 – While not unexpected that the market rewarded upside while penalizing downside, the magnitude expanded in Q3 and the market was increasingly punitive to downside surprises. Relative to the S&P 500, consistent guidance increases for each quarter this year led to +9% outperformance, while consistent guidance declines led to -43% underperformance.
- High recency bias in Q3 – Guidance reductions in the later part of 2023 have faced greater penalties due to recency bias, while recent increases in guidance have resulted in more significant outperformance compared to earlier in the year.
- Momentum growing in Q3 – Maintaining consistent guidance throughout the year resulted in underperformance (-3% YTD returns on average), trailing companies that refrained from providing guidance (+11%) altogether, and particularly trailing those companies that revised their guidance upward.
Source: FactSet
Additional Q3 Data Points
As of November 30, 2023, the number of companies reporting positive earnings surprises has crept slightly up (from 382 in Q2 to 386 in Q3), while the magnitude of these earnings surprises has increased by ~2%. As a result, the index is reporting higher earnings for Q3 relative to the end of Q2, and the first YoY earnings growth since the third quarter last year.
82% of companies have reported higher actual earnings than Street estimates in the quarter; the amount of positive earnings surprise is above the five-year average of 77% and above the ten-year average of 74% and would also be the largest percent of companies reporting positive surprises since Q3 2021, according to FactSet. For the quarter, companies are averaging a +8.8 (vs. last quarter’s +6.7%) earnings surprise and -1.2% (vs last quarter’s -0.2%) revenue surprise. This surprise percentage is above the one-year average (+4.4%), below the five-year average (+8.5%), and above the ten-year average (+6.6%).
Positive EPS Growth YoY from the Financial and Communication Services Sectors, while Real Estate and Energy Falling After Tougher Comps
Year over year, 6 of 11 sectors in the S&P have reported EPS growth with the exceptions of Real Estate (-43.2%), Energy (-33.7%), Healthcare (-9.2%), Consumer Staples (-5.0%), and Materials (-3.8%). The top performing sectors were Communication Services (+58.5%) and Financials (+26.0%). Two companies within the technology sector contributed over 50% of weighted EPS growth for the S&P 500.
The largest declines in EPS YoY came from the Real Estate sector, which saw earnings decline -43.2%, and the Energy sector, which saw a decline of -33.7%. The Real Estate sector’s earnings decline was also attributable to several companies with EPS declines between -30% and -79%. Collectively, the top three companies by market cap constitute ~25% of the sector by weight and all had outsized impacts. Stock performance for companies within the sector were mixed, largely due to tougher comps YoY.
The Energy sector also saw its earnings decline YoY, as the price of oil declined -6% throughout the year. Two of the sector’s largest companies by weight were also the 3rd and 6th largest sector-agnostic detractors of earnings growth among all S&P 500 constituents.
Source: FactSet
Companies Beating Revenue Estimates (61%) at Lowest Percentage since 2020
Revenue growth for each sector was somewhat more muted than earnings growth. 61% of companies (287 companies) have thus far reported actual revenues above consensus estimates, which is below the three-year average of 71% and below the ten-year average of 64%. 61% of positive revenue surprises would be the lowest quarterly figure since Q1 2020 (59%).
7 out of 11 sectors reported positive YoY revenue growth, led by Financials (16.0%), Real Estate (11.9%), and Communication Services (10.9%). On the contrary, Energy (-18.5%) and Materials (-7.7%) saw the largest revenue declines YoY.
Source: FactSet
1 As of 11/30, 94% of S&P 500 companies (473 of the 505 constituents) reported actual results.
2 Averages are calculated by taking the weighted average (by market cap) stock performance of companies with positive and negative earnings surprises.
3 We use the ten-year average as the long-term average metric.
4 Guidance trends peaked at ~30% in Q4’2022.
5 Weighted average return calculated by using the company’s weight within the S&P 500 as of 9/30 and its corresponding YTD performance as of 11/30.
6 This graph represents the YTD average performance of companies that have had differentiated guidance this year. Each color represents a revision of 2023 annual guidance (red – guidance was revised down, green – guidance was revised up, and grey – guidance was kept the same as the prior quarter). The YTD performance for each guidance bucket (ex. Guide Raised, Guide Raised, Guide Raised) is also provided.
7 As of 11/30, 94% of S&P 500 companies (473 of the 505 constituents) reported actual results, so the 100 companies issuing guidance is likely slightly higher.
8 Total Guide represents the sum of companies that guided at least one of the following metrics: EPS, Revenue, EBITDA, Net Income, CapEx, Free Cash Flow, SS NOI, and Net Interest Income.
9 Ibid
10 Positive and negative EPS surprises are calculated by taking the weighted average (by market cap) of each S&P constituent. The total calculation is also a weighted average calculation, and thus doesn’t lie in the middle of the negative and positive EPS surprises.
11 Results calculated by taking average price moves for the companies, the S&P 500, and S&P subsector ETFs over the five days following each company’s earnings announcement. The large caveat here is we are assuming 100% of the price moves are as a direct result of the companies’ earnings; in reality, there are idiosyncratic and correlation risks affecting price moves.
12 Weighted average EPS surprise for positive and negative surprises, and respective average share performance 2 months prior to earnings and 5 days after earnings.
13 Earnings surprises broken down by positive and negative surprises for all 11 S&P sectors.
Disclosures
This paper has been prepared by Consello MB LLC (“Consello”) for the party to whom it has been addressed and delivered and may not be used or relied upon for any purpose other than as specifically contemplated. This paper is based on information provided by or on behalf third parties, from public sources or otherwise reviewed by Consello. Consello assumes no responsibility for independent investigation or verification of such information and has relied on such information being complete and accurate in all material respects. To the extent such information includes estimates and forecasts of future financial performance or events, Consello has assumed that such estimates and forecasts are reasonable. No representation or warranty, express or implied, is made as to the accuracy or completeness of such information and nothing contained herein is, or shall be relied upon as, a representation, whether as to the past, the present or the future. This paper should not be considered a recommendation with respect to any matter. This paper has been developed by and is proprietary to Consello.
This paper was compiled on a confidential basis and not with a view to public disclosure or filing thereof under state or federal securities laws, and may not be reproduced, disseminated, quoted or referred to, in whole or in part, without the prior written consent of Consello.
This paper does not constitute an offer to sell or a solicitation of an offer to purchase any securities and is not a commitment by Consello (or any affiliate) to provide or arrange any financing for any transaction or to purchase any security in connection therewith. This paper may not reflect information known to other professionals in other business areas of Consello and its affiliates.
Consello and its affiliates do not provide legal, accounting or tax advice. Accordingly, any statements contained herein as to tax matters were neither written nor intended by Consello or its affiliates to be used and cannot be used by any taxpayer for the purpose of avoiding tax penalties that may be imposed on such taxpayer. Each person should seek legal, accounting and tax advice based on his, her or its particular circumstances from independent advisors regarding the impact of the transactions or matters described herein.
Broker-dealer services are provided through Pickwick Capital Partners, LLC (Member FINRA and SIPC), 445 Hamilton Avenue, Suite 1102, White Plains, NY 10601, (914) 358-3269.
Opinion and Belief; Forward-Looking Statements
Past performance is not necessarily indicative of future results. Certain statements contained in this paper may be based on current expectations, estimates, projections, opinions and beliefs of Consello. All views expressed and any statements relating to expectations regarding future events represent Consello’s own assessment and interpretation of information available to it as at the date of this paper. Such statements involve known and unknown risks, uncertainties and other factors, and undue reliance should not be placed thereon. Such statements represent solely the opinion or belief of Consello and are not expressed herein as the opinion or belief of any other entity or of members of the Consello team or other persons. No representation is made or assurance given that such statements or views are correct. Opinions expressed and other information or statements herein are subject to change without notice. Any discussion of general market activity, industry or sector trends, or other broad-based economic, market, political or regulatory conditions should not be construed as research or advice.
Additionally, this paper contains “forward-looking statements,” which can be identified by the use of terms such as “may”, “will”, “should”, “expect”, “anticipate”, “project”, “estimate”, “intend”, “see”, “continue,” “target,” “plan” or “believe” (or the negatives thereof) or other variations thereon or comparable terminology or forward-looking context. Furthermore, any projections or other estimates in this paper are “forward-looking statements” and are based upon certain assumptions that may change. Due to various risks and uncertainties, actual events may differ materially from those reflected or contemplated in such forward-looking statements. Moreover, actual events are difficult to project and often depend upon factors that are beyond the control of Consello and its affiliates. Recipients of this paper should not rely on such forward-looking statements, and no representation or warranty is made as to future events or results or such forward-looking statements. Nothing in this paper constitutes a guarantee, projection or prediction of future events or results.
Unless otherwise noted, information in this paper is presented as of the date hereof and does not reflect any facts, events or circumstances that may have arisen after that date, is subject to discussion, completion and amendment and does not contain all information necessary to fully evaluate any transaction. Neither Consello nor any other person has any obligation to update this paper (including forward-looking statements herein) or correct inaccuracies or omissions in it.
Copyright © 2023 Consello MB LLC. All rights reserved.